Research
/Security News
Critical Vulnerability in NestJS Devtools: Localhost RCE via Sandbox Escape
A flawed sandbox in @nestjs/devtools-integration lets attackers run code on your machine via CSRF, leading to full Remote Code Execution (RCE).
rq-dashboard is a general purpose, lightweight, web interface to monitor your RQ queues, jobs, and workers in realtime.
rq-dashboard is a general purpose, lightweight,
Flask-based web front-end to monitor your
RQ queues, jobs, and workers in realtime.
The RQ dashboard is currently being developed and is in beta stage. How migrate to version 1.0 you can find here
You can find help in the discussion page in github or join our discord server
You can also run the dashboard inside of docker:
copy the docker-compose.yml file from the root of the repository to docker-compose.override.yml and change the environment variables to your liking.
run the following command:
$ docker-compose up
You can also find the official image on cjlapao/rq-dashboard:latest
$ pip install rq-dashboard
Run the dashboard standalone, like this:
$ rq-dashboard
* Running on http://127.0.0.1:9181/
...
$ rq-dashboard --help
Usage: rq-dashboard [OPTIONS]

  Run the RQ Dashboard Flask server.

  All configuration can be set on the command line or through environment
  variables of the form RQ_DASHBOARD_*. For example RQ_DASHBOARD_USERNAME.

  A subset of the configuration (the configuration parameters used by the
  underlying flask blueprint) can also be provided in a Python module
  referenced using --config, or with a .cfg file referenced by the
  RQ_DASHBOARD_SETTINGS environment variable.

Options:
  -b, --bind TEXT                 IP or hostname on which to bind HTTP server
  -p, --port INTEGER              Port on which to bind HTTP server
  --url-prefix TEXT               URL prefix e.g. for use behind a reverse
                                  proxy
  --username TEXT                 HTTP Basic Auth username (not used if not
                                  set)
  --password TEXT                 HTTP Basic Auth password
  -c, --config TEXT               Configuration file (Python module on search
                                  path)
  -u, --redis-url TEXT            Redis URL. Can be specified multiple times.
                                  Default: redis://127.0.0.1:6379
  --poll-interval, --interval INTEGER
                                  Refresh interval in ms
  --extra-path TEXT               Append specified directories to sys.path
  --disable-delete                Disable delete jobs, clean up registries
  --debug / --normal              Enter DEBUG mode
  -v, --verbose                   Enable verbose logging
  -j, --json                      Enable JSONSerializer
  --help                          Show this message and exit.
The dashboard can be integrated in to your own Flask app by accessing the blueprint directly in the normal way, e.g.:
from flask import Flask
import rq_dashboard

app = Flask(__name__)
app.config.from_object(rq_dashboard.default_settings)
rq_dashboard.web.setup_rq_connection(app)
app.register_blueprint(rq_dashboard.blueprint, url_prefix="/rq")

@app.route("/")
def hello():
    return "Hello World!"

if __name__ == "__main__":
    app.run()
If you start the Flask app on the default port, you can access the
dashboard at http://localhost:5000/rq. The cli.py:main entry point
provides a simple working example.
Consider using third-party project rq-dashboard-on-heroku, which installs rq-dashboard from PyPI and wraps in in Gunicorn for deployment to Heroku. rq-dashboard-on-heroku is maintained indepdently.
You can run the dashboard as a systemd service in Linux or via a suprevisor
script and then use Apache or NGINX to direct traffic to the dashboard.
This is for non-production functionality!
Apache Reverse Proxy example:
ProxyPass /rq http://127.0.0.1:5001/rq
ProxyPassReverse /rq http://127.0.0.1:5001/rq
Systemd service example:
[Unit]
Description=Redis Queue Dashboard
[Install]

WantedBy=multi-user.target
[Service]
ExecStart=/bin/rq-dashboard -b 127.0.0.1 -p 5001 --url-prefix /rq -c rq_settings_dashboard --debug -v
StandardOutput=file:/var/log/redis/rq-dasbhoard.log
StandardError=file:/var/log/redis/rq-dashboard.log
User=redis-dash
Group=redis-dash
RemainAfterExit=yes
Type=simple
PermissionsStartOnly=false
PrivateTmp=no
--debug,-v are optional -- they will write stdout to your specified files.rq_settings_dashboard is a Python file, with settings defined. You can use options that are available as environmental variables. (EX. RQ_DASHBOARD_REDIS_PASSWORD = password)Develop in a virtualenv and make sure you have all the necessary build time (and run time) dependencies with
$ pip install -r requirements.txt
Develop in the normal way with
$ python setup.py develop
FAQs
rq-dashboard is a general purpose, lightweight, web interface to monitor your RQ queues, jobs, and workers in realtime.
We found that rq-dashboard demonstrated a healthy version release cadence and project activity because the last version was released less than a year ago. It has 5 open source maintainers collaborating on the project.
Did you know?

Socket for GitHub automatically highlights issues in each pull request and monitors the health of all your open source dependencies. Discover the contents of your packages and block harmful activity before you install or update your dependencies.

Research
/Security News
A flawed sandbox in @nestjs/devtools-integration lets attackers run code on your machine via CSRF, leading to full Remote Code Execution (RCE).

Product
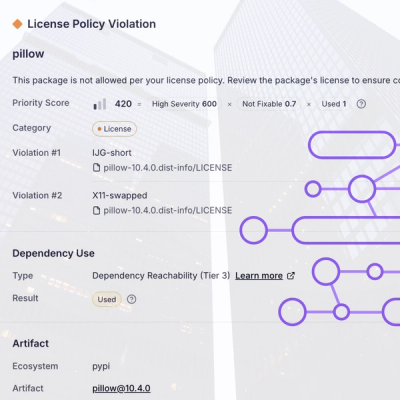
Customize license detection with Socket’s new license overlays: gain control, reduce noise, and handle edge cases with precision.

Product
Socket now supports Rust and Cargo, offering package search for all users and experimental SBOM generation for enterprise projects.