Star-Chart-Spherical-Projection


A Python package to generate circular astronomy star charts (past, present, and future) with spherical projection to correct for distortions with all IAU named stars accurate over 400,000 years with proper motion and precession of the equinoxes
- Plot Stars on a Polar Chart
- plotStereographicProjection()
- Return Final Position of Stars
- finalPositionOfStars()
- starPositionOverTime()
- predictPoleStar()
- Add a New Star to Plot
Quickstart: Star-Chart-Spherical-Projection
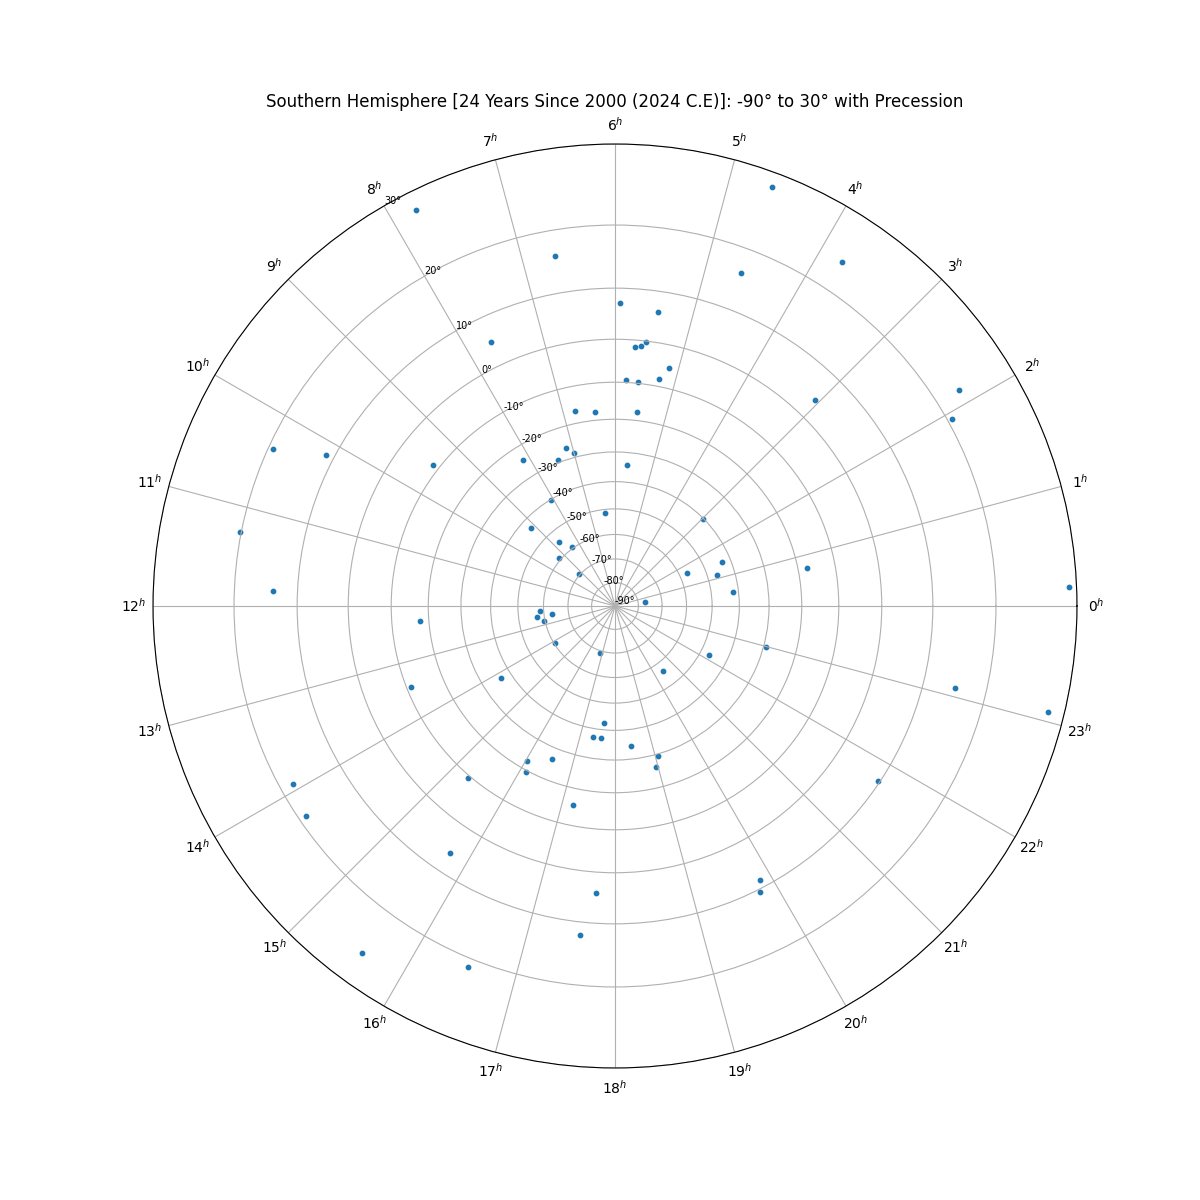
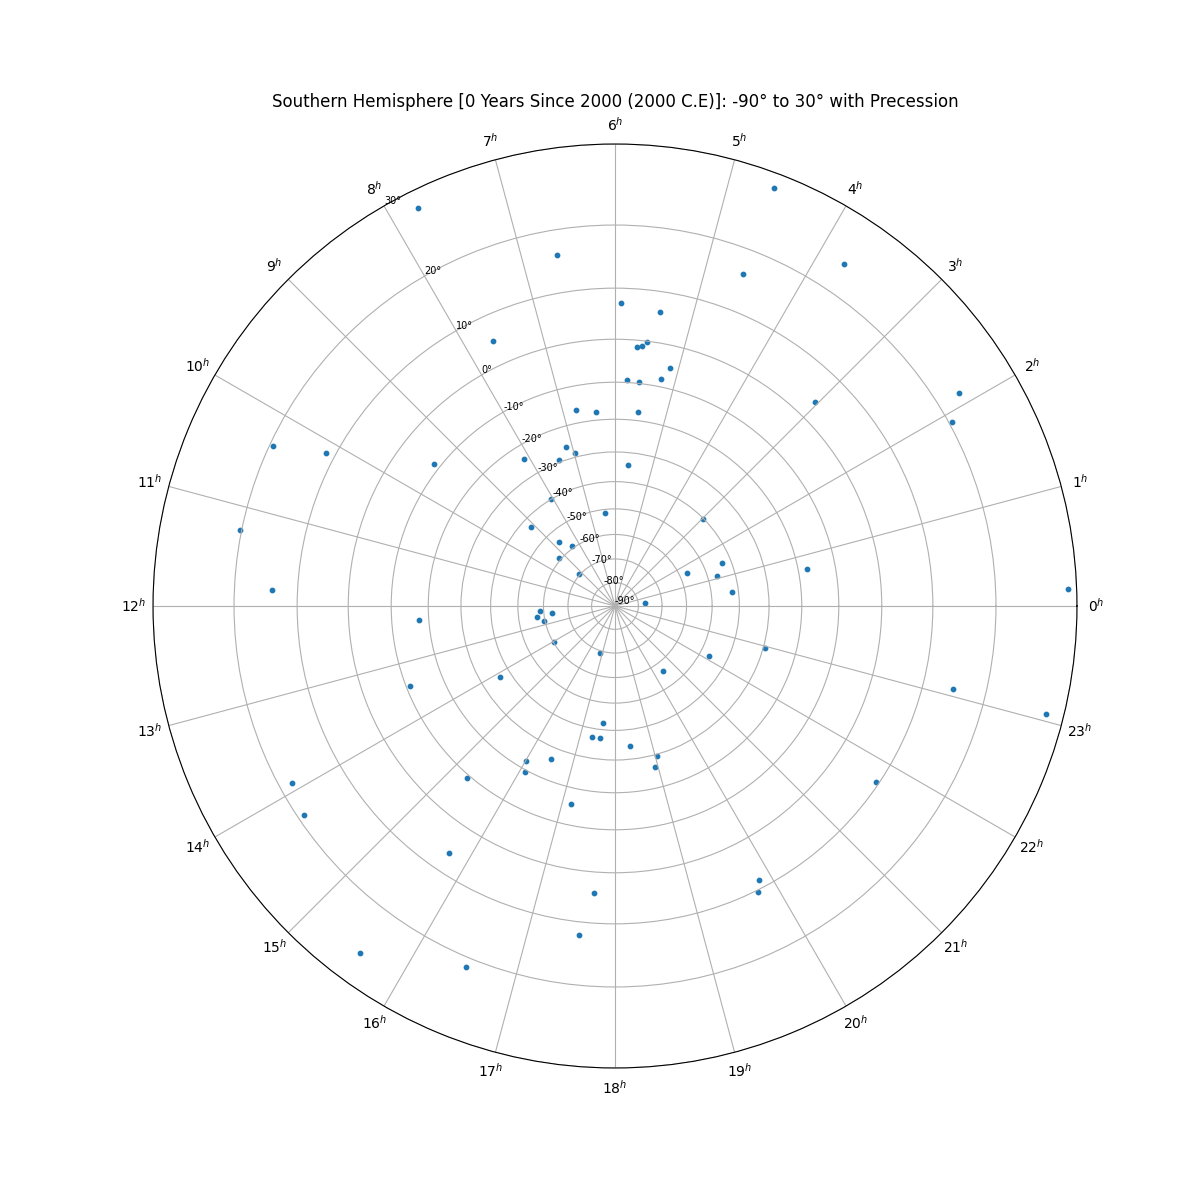
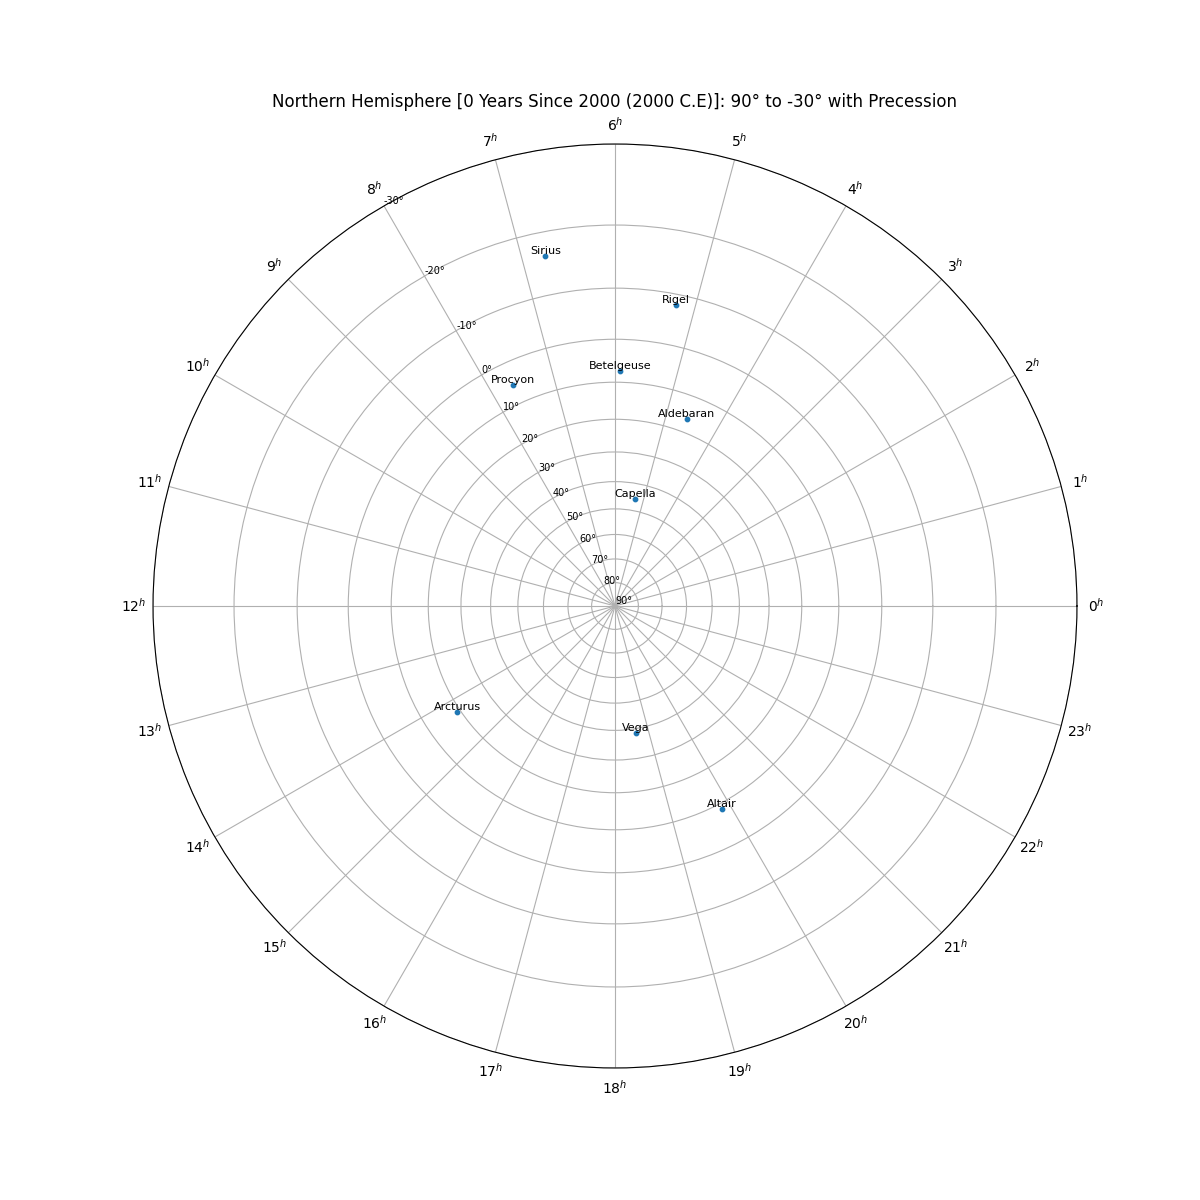
Plot stars in the Southern Hemisphere for the year 2024 (without stars labels)
import star_chart_spherical_projection as scsp
scsp.plotStereographicProjection(northOrSouth="South",
displayStarNamesLabels=False,
yearSince2000=24)
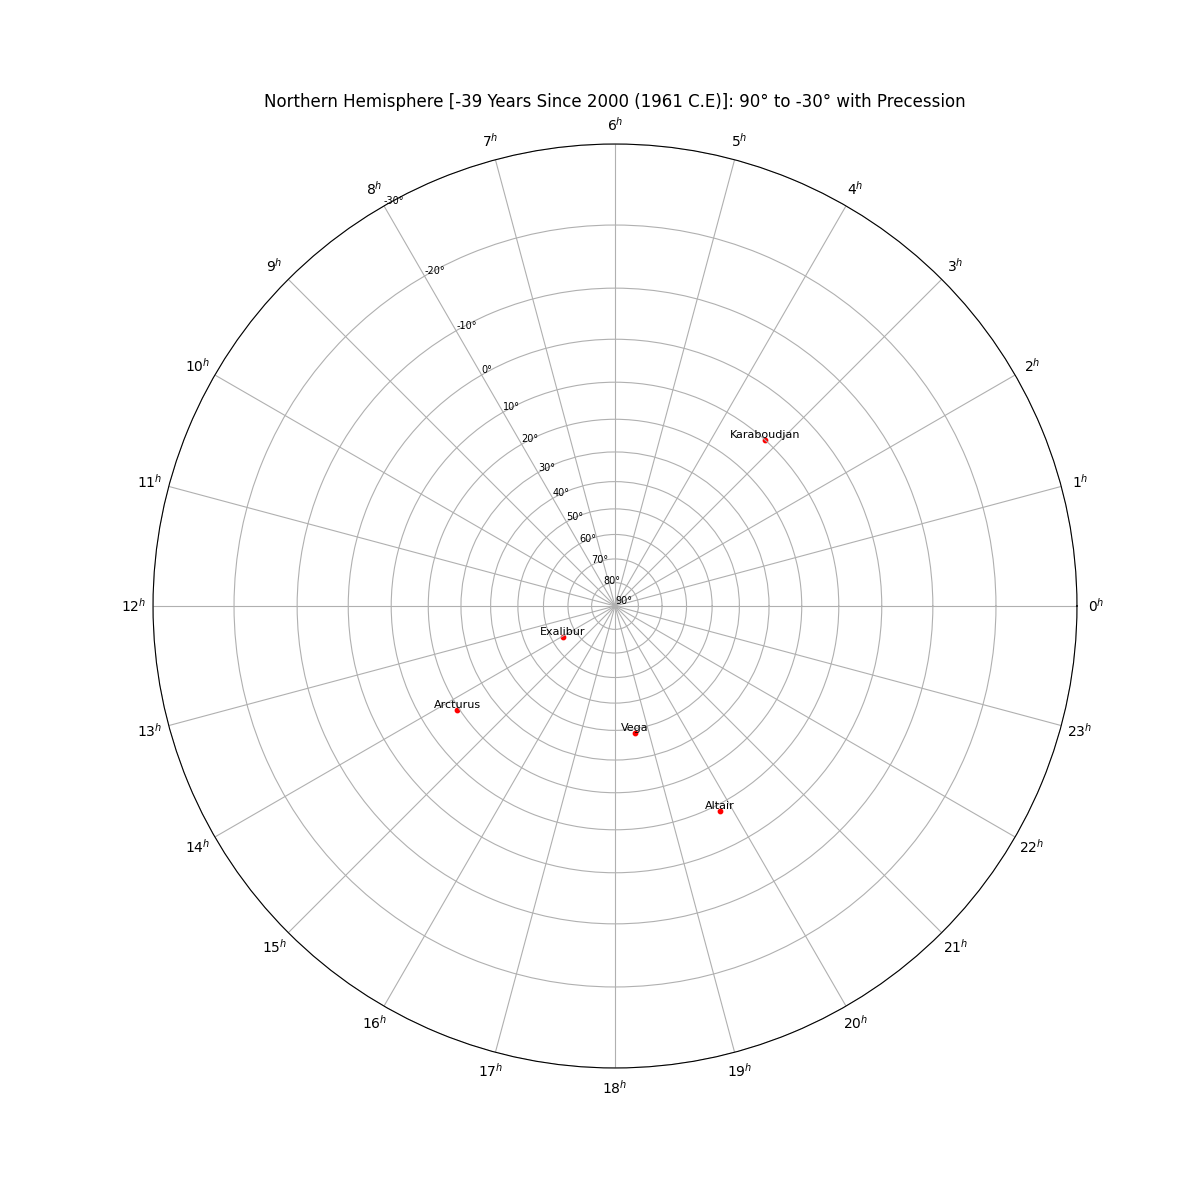
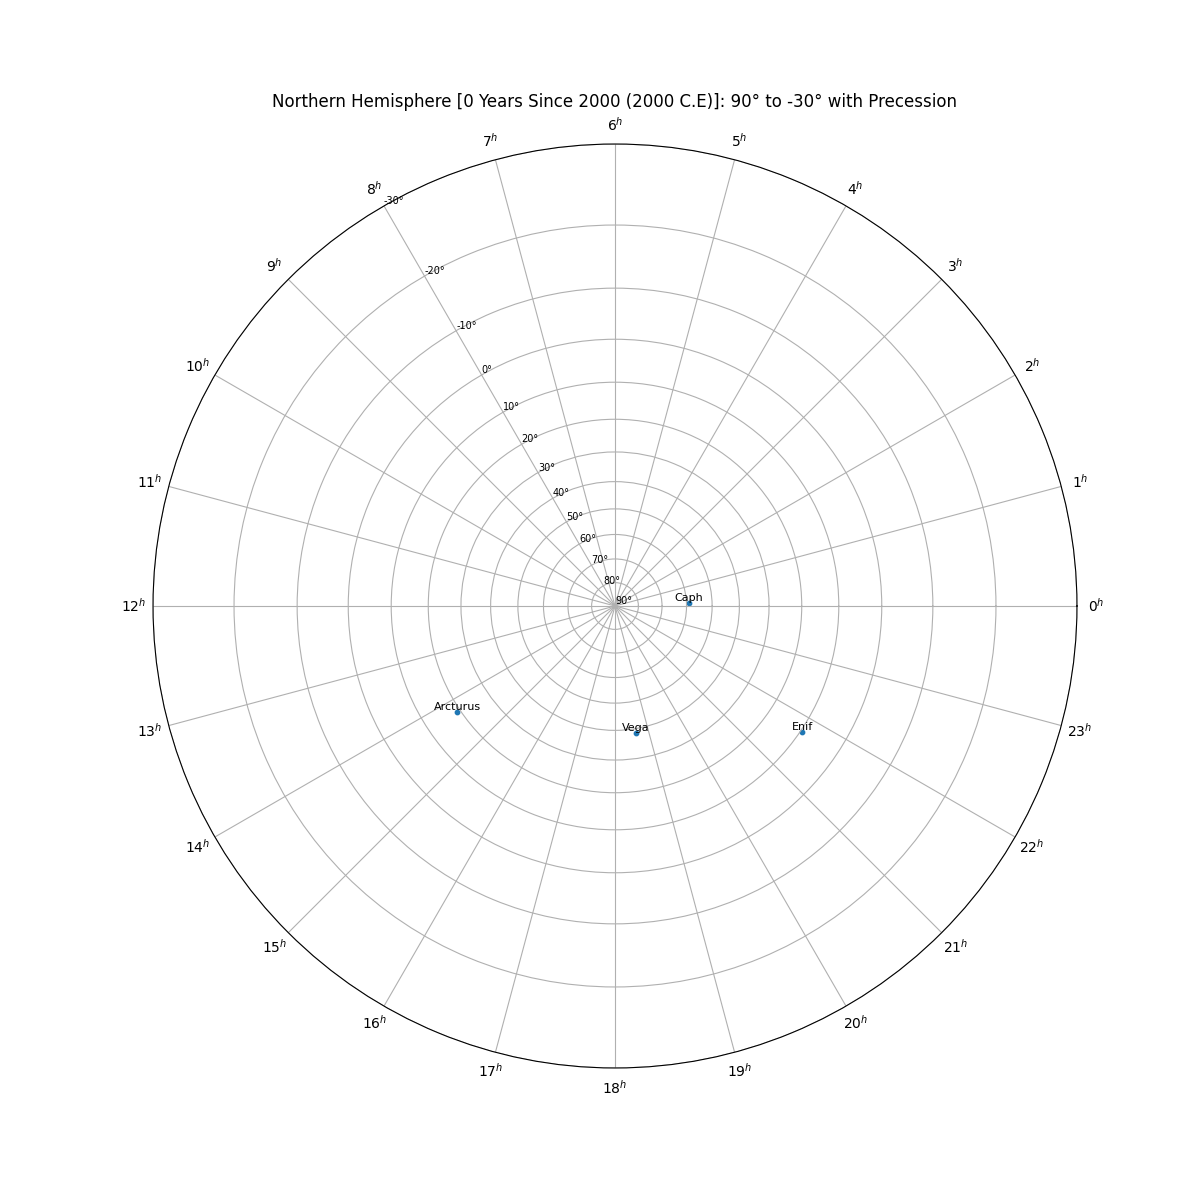
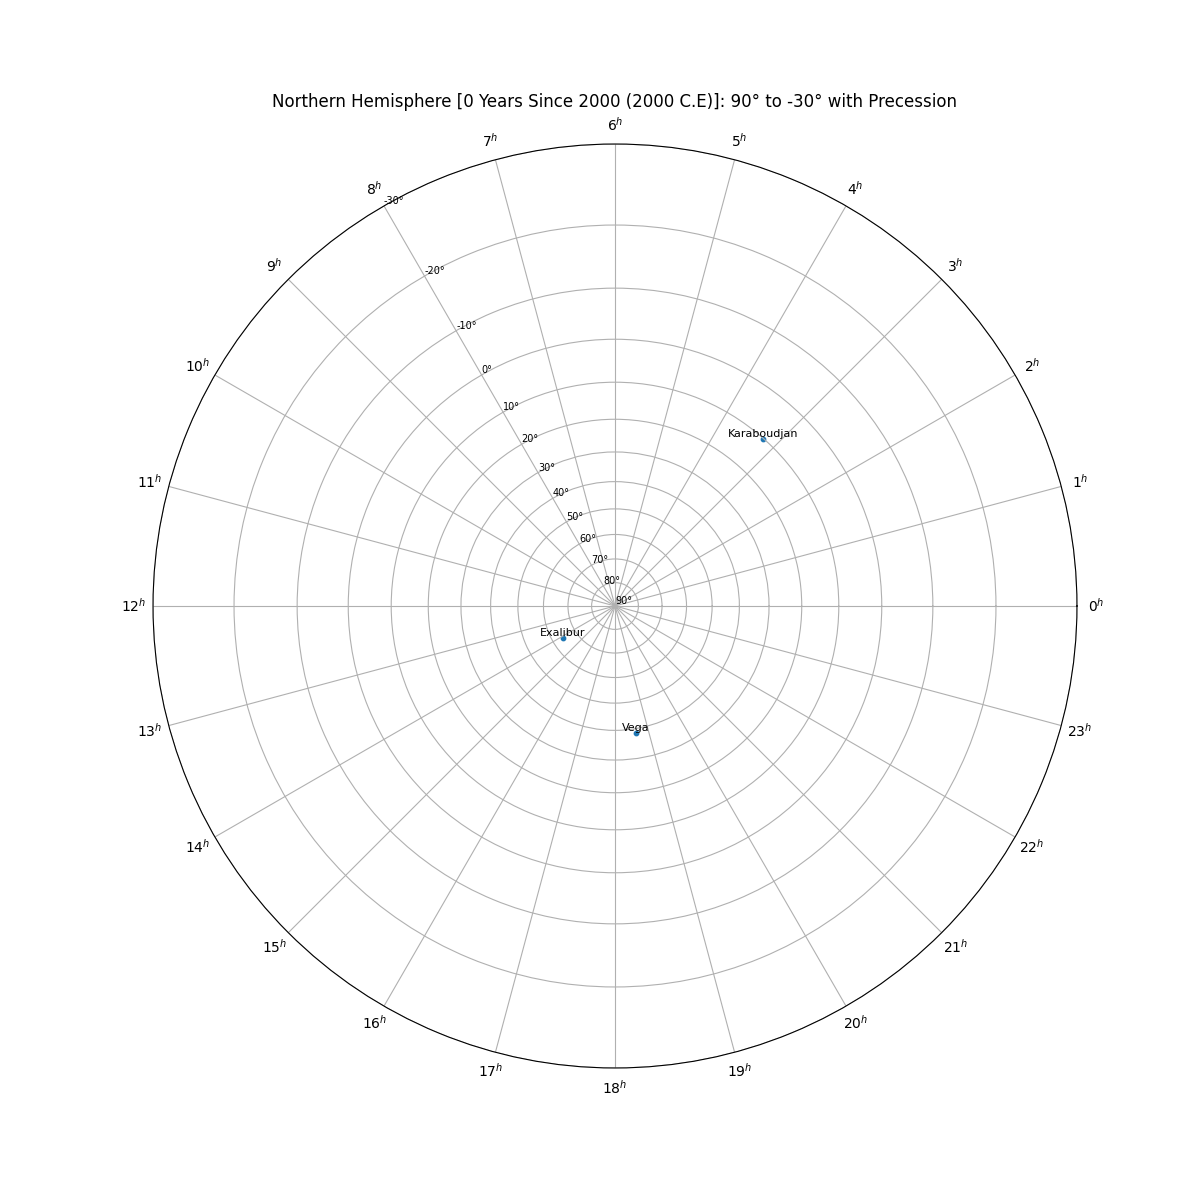
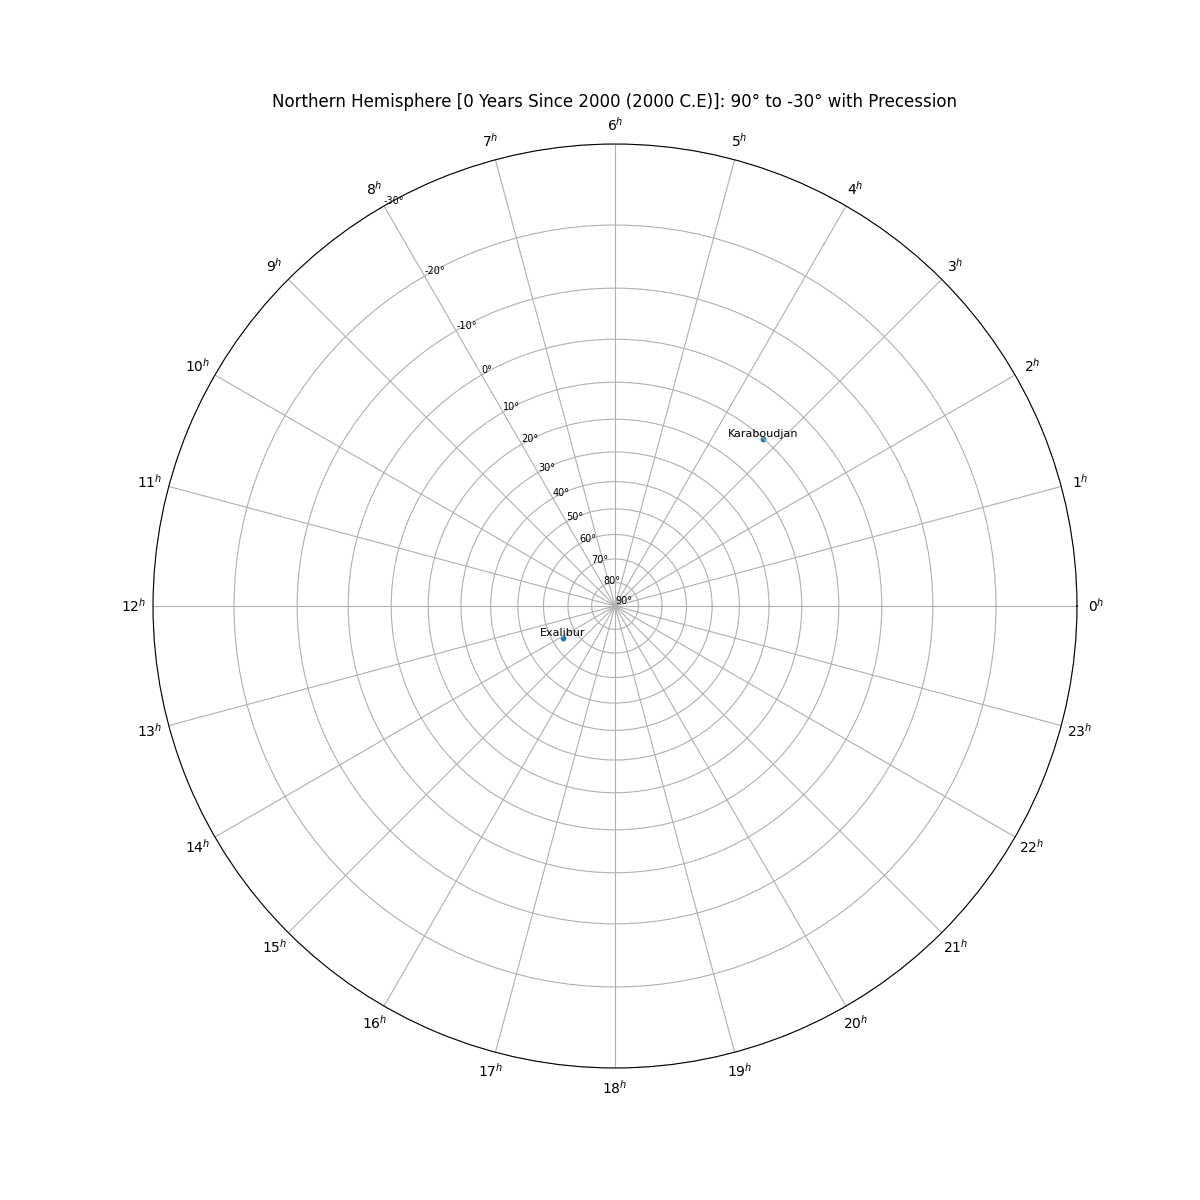
Plot a few built-in stars as well as two new user defined stars in the Northern Hemisphere for the year 1961 (2000-39) (with stars labels and in red). This uses both methods to define the proper motion for new stars: with a given proper motion and angle and with the proper motion speed in the declination and right ascension
import star_chart_spherical_projection as scsp
exalibur_star = scsp.newStar(starName="Exalibur",
ra="14.04.23",
dec=64.22,
properMotionSpeed=12.3,
properMotionAngle=83,
magnitudeVisual=1.2)
karaboudjan_star = scsp.newStar(starName="Karaboudjan",
ra="3.14.15",
dec=10.13,
properMotionSpeedRA=57.6,
properMotionSpeedDec=60.1,
magnitudeVisual=0.3)
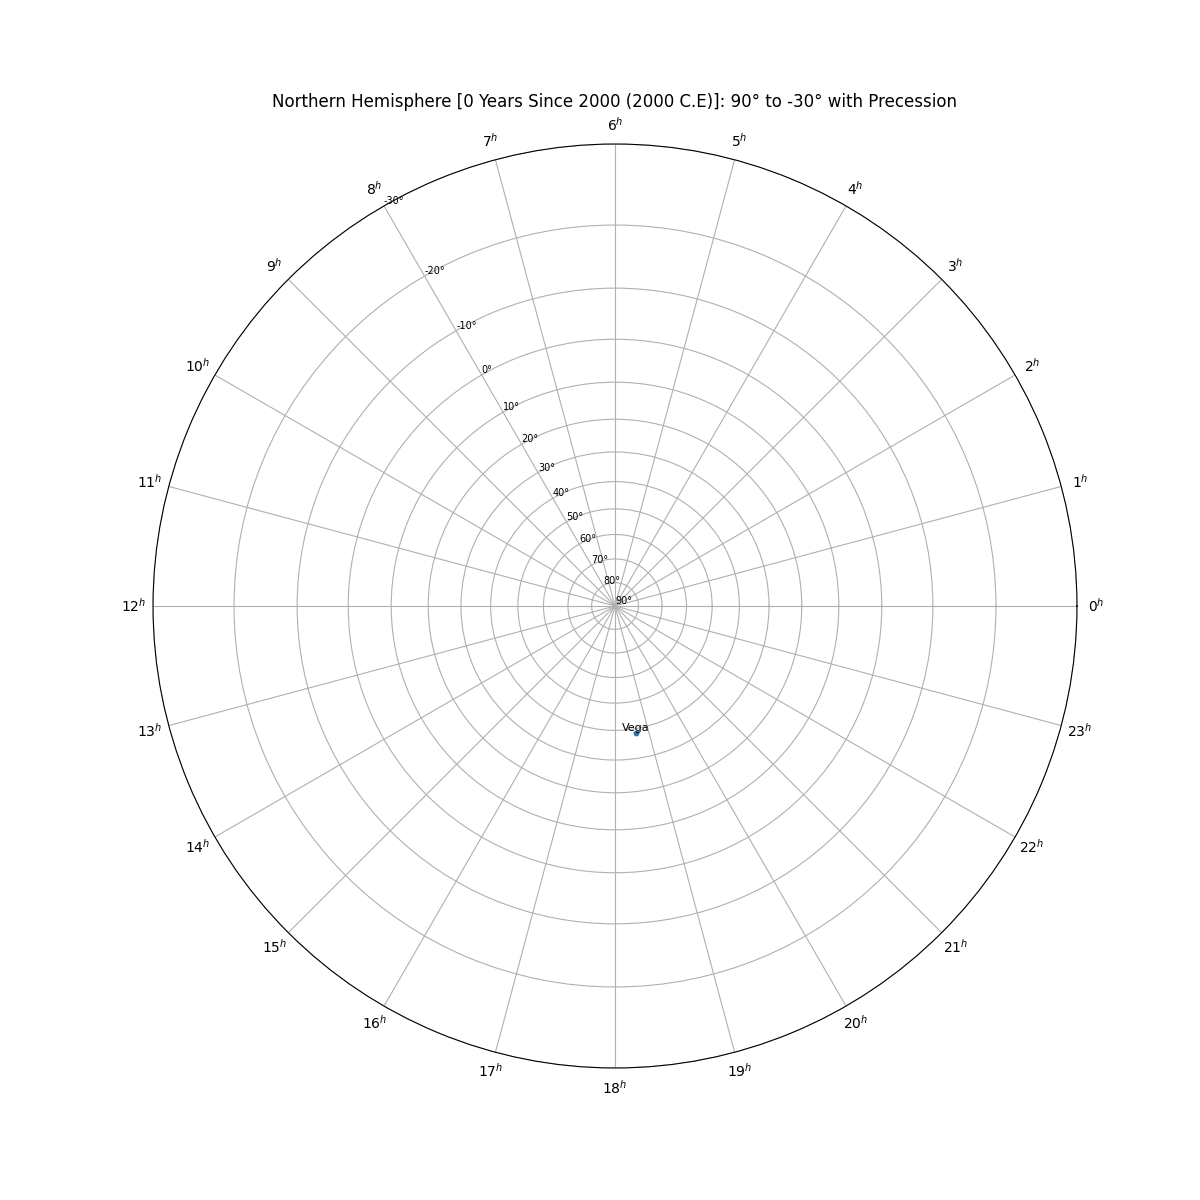
scsp.plotStereographicProjection(northOrSouth="North",
builtInStars=["Vega", "Arcturus", "Altair"],
userDefinedStars=[exalibur_star, karaboudjan_star],
displayStarNamesLabels=True,
fig_plot_color="red",
yearSince2000=-39)
Return the final position of a Vega (can be a single star or a list of stars) after 11,500 years when Vega is the new North Pole Star (star closest to +90°)
import star_chart_spherical_projection as scsp

star_final_pos_dict = scsp.finalPositionOfStars(builtInStars=["Vega"],
						yearSince2000=11500,
						save_to_csv="final_star_positions.csv")
Returns a dictionary with a star and its declination and right ascension: {'Vega': {'Declination': 83.6899118156341, 'RA': '05.38.21'}}
The final position of the stars are saved in final_star_positions.csv with the headers ["Star Name", "Right Ascension (HH.MM.SS)", "Declination (DD.SS)"]
Install
PyPi pip install at pypi.org/project/star-chart-spherical-projection/
pip install star-chart-spherical-projection
Overview
The first step to plot the celestial sphere onto a 2D plot is to map the star's right ascension as hours along the plot (matplotlib polar plot's theta value) and declination as the distance from the center of the circle (matplotlib polar plot's radius value). However, attempting to map the right ascension and declination directly will cause distortion since the angles between the stars along the declination are no longer conserved. On the left, the constellation of the Big Dipper is stretched into an unfamiliar shape due to this distortion. By accounting for the spherical transformation, the star chart can be corrected as seen on the right.
The sphere is projected from the South Pole (via Stereographic projection):
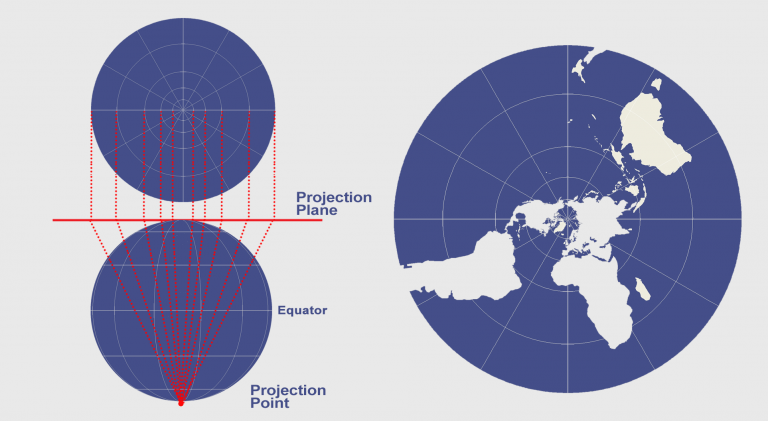
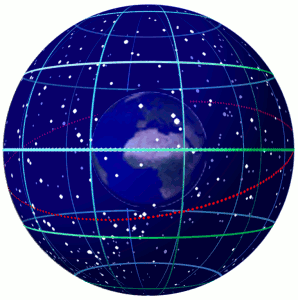
From the perspective of an observer on the Earth's surface, the stars appear to sit along the surface of the celestial sphere--an imaginary sphere of arbitrary radius with the Earth at its center. All objects in the sky will appear projected on the celestial sphere regardless of their true distance from Earth. Each star's position is given by two values. Declination is the angular distance from the celestial equator and right ascension is the distance from the position of the vernal equinox. During the course of a full 24-hour day, stars will appear to rotate across the sky as a result of the Earth's rotation, but their position is fixed. A star’s actual position does change over time as the combined result of the star’s small movement (proper motion) as well as the changing rotational axis of the Earth (precession).
Spherical projection can overcome angular distortion by converting the position of the declination to:
# Projected from South Pole (Northern Hemisphere)
north_hemisphere_declination = tan(45° + (original_declination / 2))

# Projected from North Pole (Southern Hemisphere)
south_hemisphere_declination = tan(45° - (original_declination / 2))
Where in the Northern Hemisphere, projections are formed from the South Pole:

Add a New Star
newStar Object
The star chart package comes with over a hundred of brightest stars as part of a built-in library. However, a new star can be easily added for plotting or calculations by creating a newStar object. The newStar object will require a few important features that plotStereographicProjection() and finalPositionOfStars() can now accept as an additional argument.
This allows for the creation of a new star in two ways:
1. With a Proper Motion Speed and a Proper Motion Angle
As seen in in-the-sky.org for Pollux
star_chart_spherical_projection.newStar(starName=None,
					ra=None,
					dec=None,
					properMotionSpeed=None,
					properMotionAngle=None,
					magnitudeVisual=None)
- [REQUIRED] starName: (string) A star name to be displayed as a label
- [REQUIRED] ra: (string) Right Ascension of star as a string with three parts 'HH.MM.SS' (Hours, Minutes, Seconds)
- [REQUIRED] dec: (int/float) Declination of star (a positive or negative value)
- [REQUIRED] properMotionSpeed: (int/float) Proper motion speed as a single value (in mas/year)
- [REQUIRED] properMotionAngle: (int/float) Proper motion positive angle (between 0° and 360°)
- [REQUIRED] magnitudeVisual: (int/float) Absolute Visual Magnitude
With the Proper Motion speed along the Right Ascension and Declination
As seen in wikipeida.og for Pollux
star_chart_spherical_projection.newStar(starName=None,
					ra=None,
					dec=None,
					properMotionSpeedRA=None,
					properMotionSpeedDec=None,
					magnitudeVisual=None)
- [REQUIRED] starName: (string) A star name to be displayed as a label
- [REQUIRED] ra: (string) Right Ascension of star as a string with three parts 'HH.MM.SS' (Hours, Minutes, Seconds)
- [REQUIRED] dec: (int/float) Declination of star (a positive or negative value)
- [REQUIRED] properMotionSpeedRA: (int/float) Speed of Proper Motion along the Right Ascension
- [REQUIRED] properMotionSpeedDec: (int/float) Speed of Proper Motion along the Declination
- [REQUIRED] magnitudeVisual: (int/float) Absolute Visual Magnitude
Important Note: RA/Dec proper motion will be converted from speed along the right ascension and declination to a proper motion speed (properMotionSpeed) and an angle (properMotionAngle) for further calculations
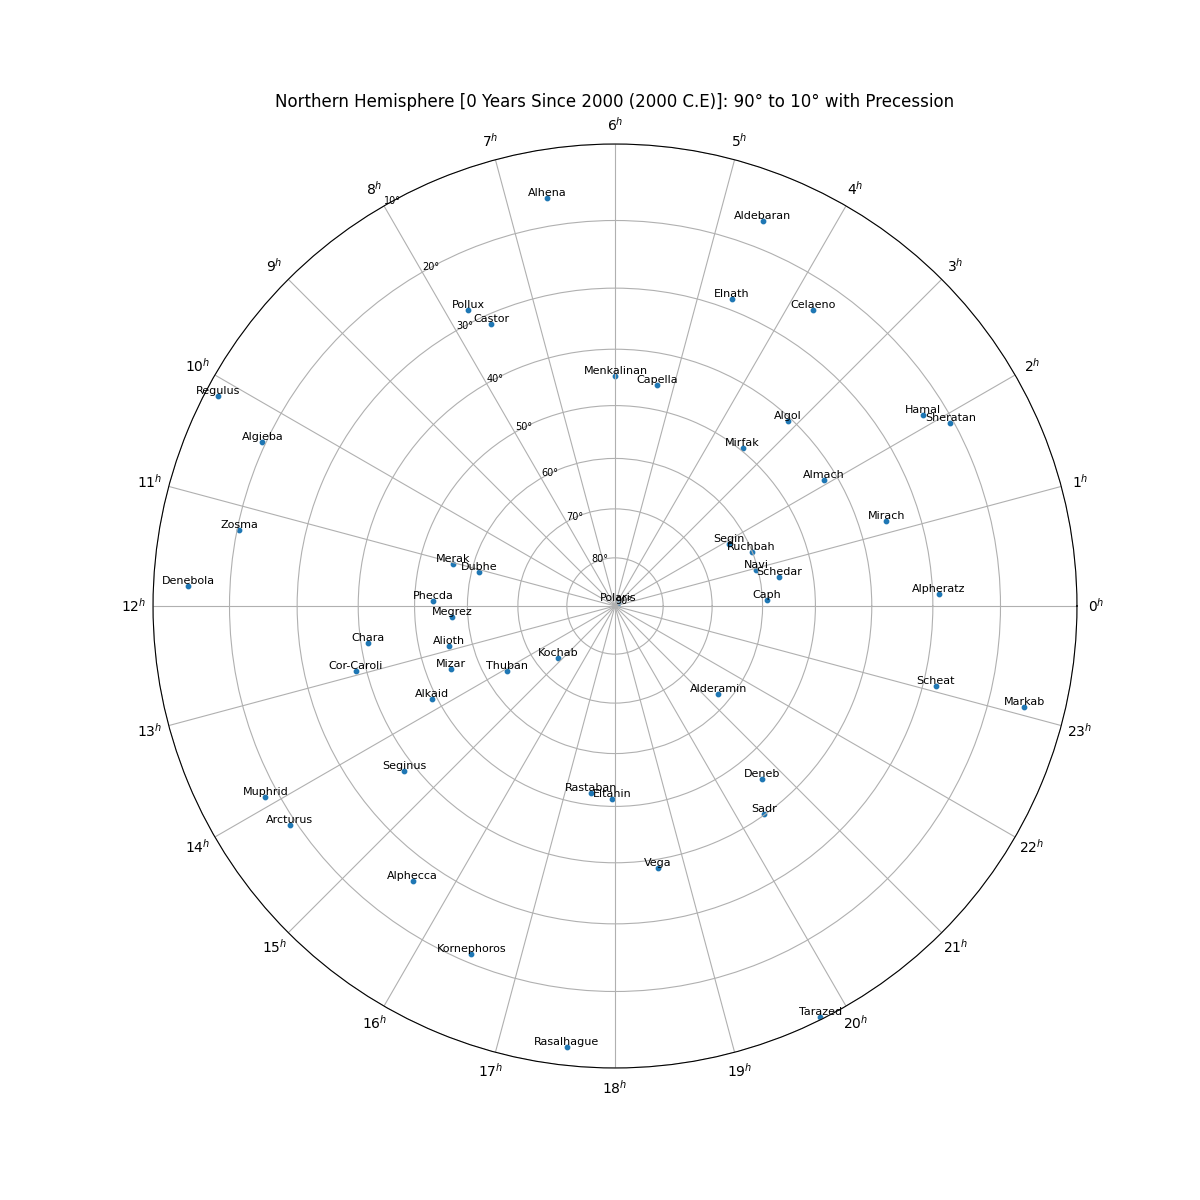
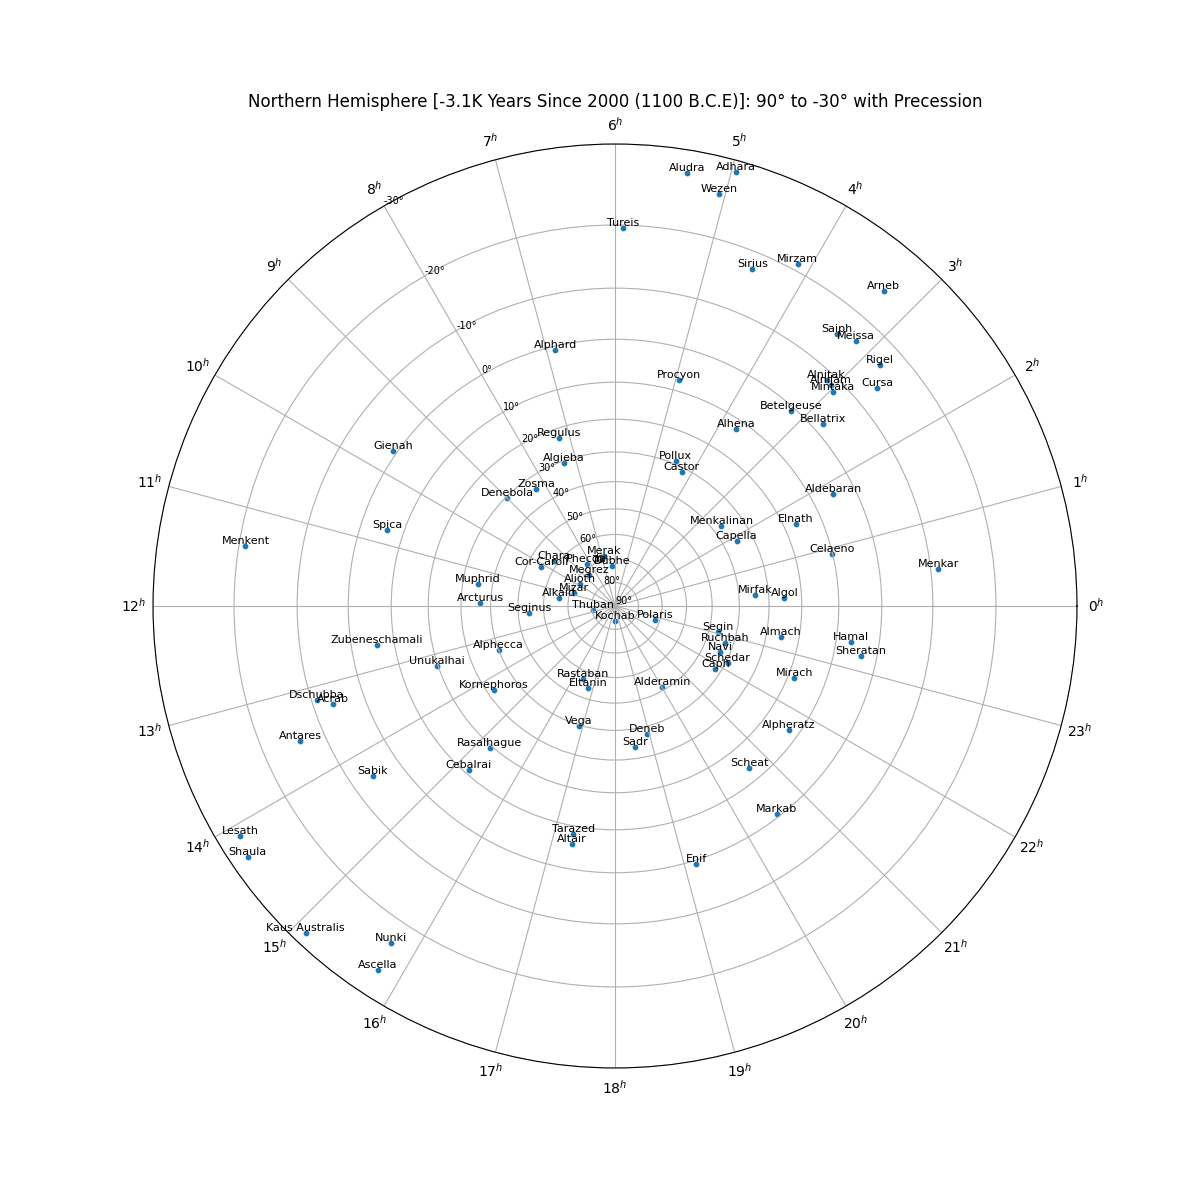
Stars Built-in (Click to view all)
['Acamar', 'Achernar', 'Acrab', 'Acrux', 'Adhara', 'Aldebaran', 'Alderamin', 'Algieba', 'Algol', 'Alhena', 'Alioth', 'Alkaid', 'Almach', 'Alnair', 'Alnilam', 'Alnitak', 'Alphard', 'Alphecca', 'Alpheratz', 'Altair', 'Aludra', 'Ankaa', 'Antares', 'Arcturus', 'Arneb', 'Ascella', 'Aspidiske', 'Atria', 'Avior', 'Bellatrix', 'Beta Hydri', 'Beta Phoenicis', 'Betelgeuse', 'Canopus', 'Capella', 'Caph', 'Castor', 'Cebalrai', 'Celaeno', 'Chara', 'Cor-Caroli', 'Cursa', 'Delta Crucis', 'Delta Velorum', 'Deneb', 'Denebola', 'Diphda', 'Dschubba', 'Dubhe', 'Elnath', 'Eltanin', 'Enif', 'Formalhaut', 'Gacrux', 'Gamma Phoenicis', 'Gienah', 'Hadar', 'Hamal', 'Kaus Australis', 'Kochab', 'Kornephoros', 'Lesath', 'Markab', 'Megrez', 'Meissa', 'Menkalinan', 'Menkar', 'Menkent', 'Merak', 'Miaplacidus', 'Mimosa', 'Mintaka', 'Mirach', 'Mirfak', 'Mirzam', 'Mizar', 'Muphrid', 'Naos', 'Navi', 'Nunki', 'Peacock', 'Phact', 'Phecda', 'Polaris', 'Pollux', 'Procyon', 'Rasalhague', 'Rastaban', 'Regulus', 'Rigel', 'Ruchbah', 'Sabik', 'Sadr', 'Saiph', 'Sargas', 'Scheat', 'Schedar', 'Segin', 'Seginus', 'Shaula', 'Sheratan', 'Sirius', 'Spica', 'Suhail', 'Tarazed', 'Thuban', 'Tureis', 'Unukalhai', 'Vega', 'Wezen', 'Zosma', 'Zubeneschamali']
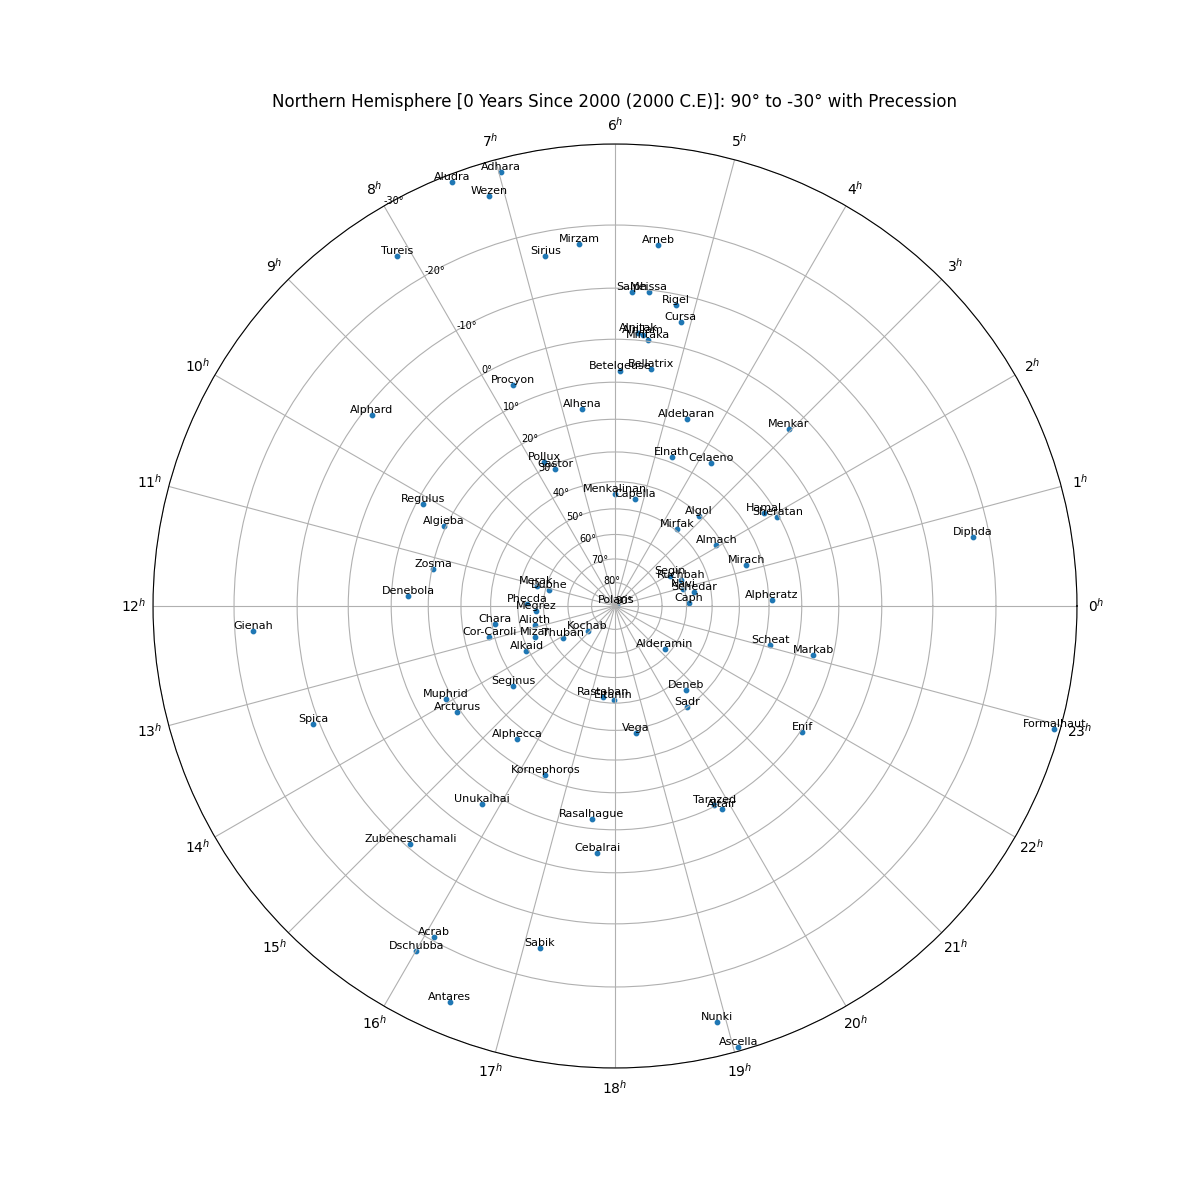
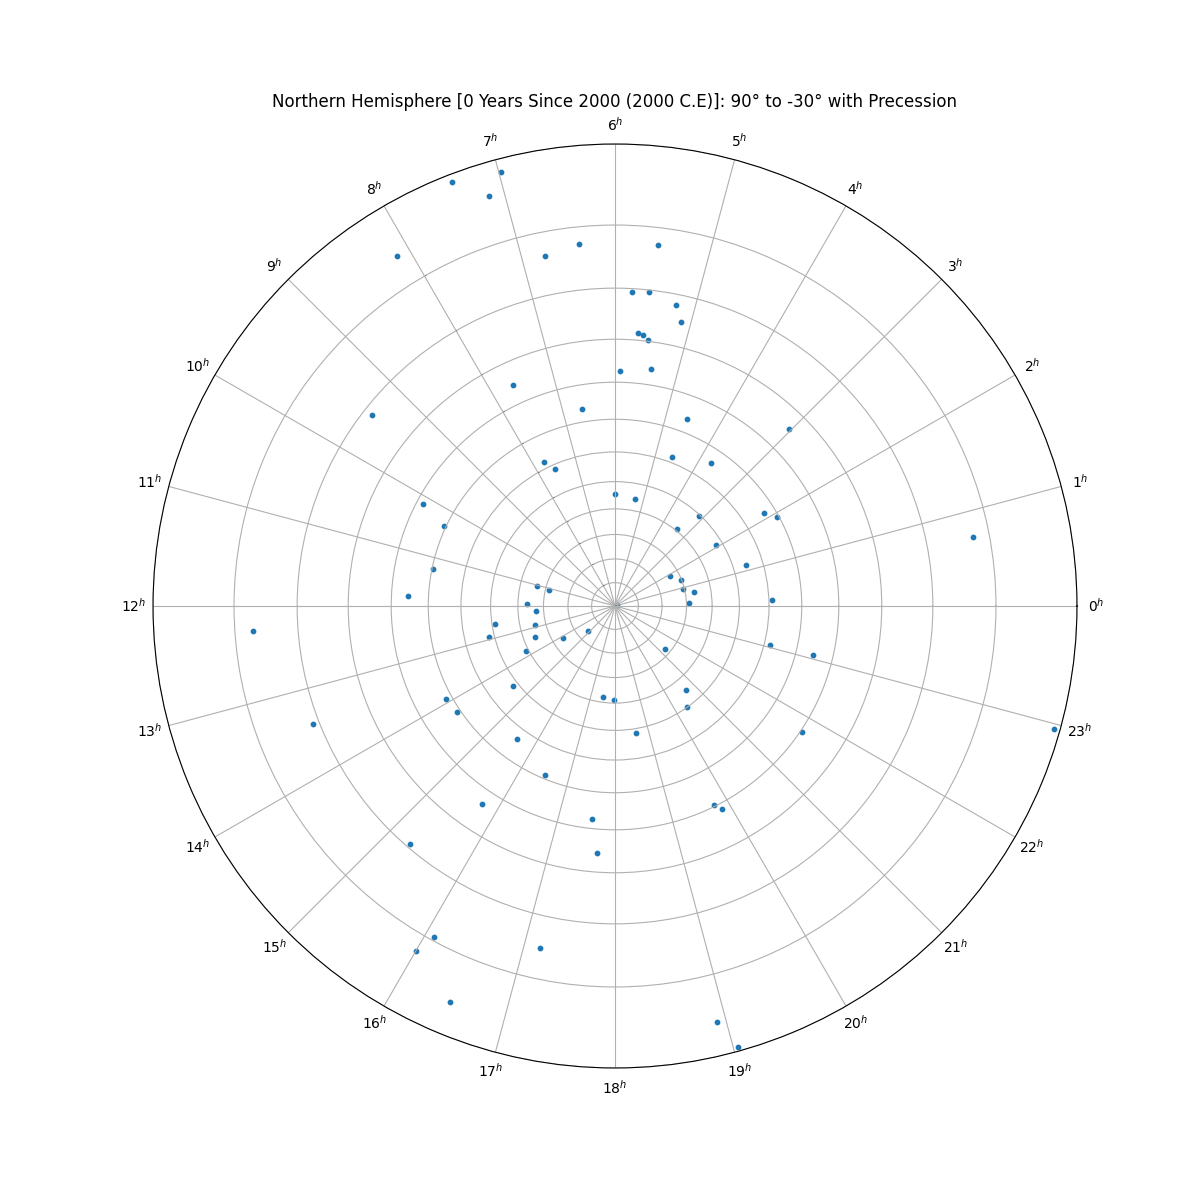
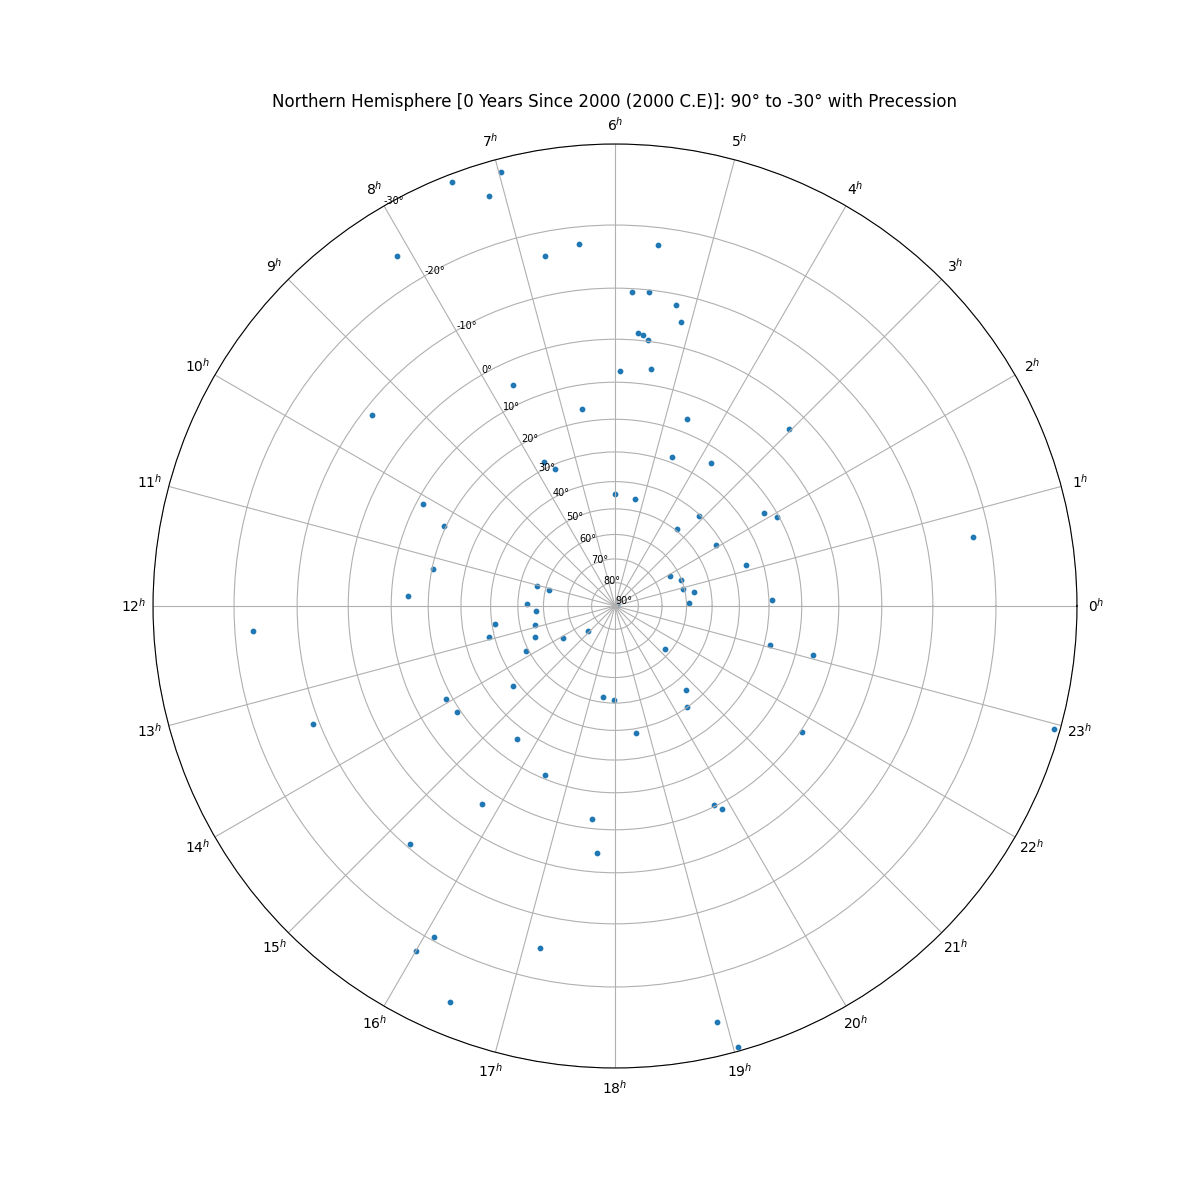
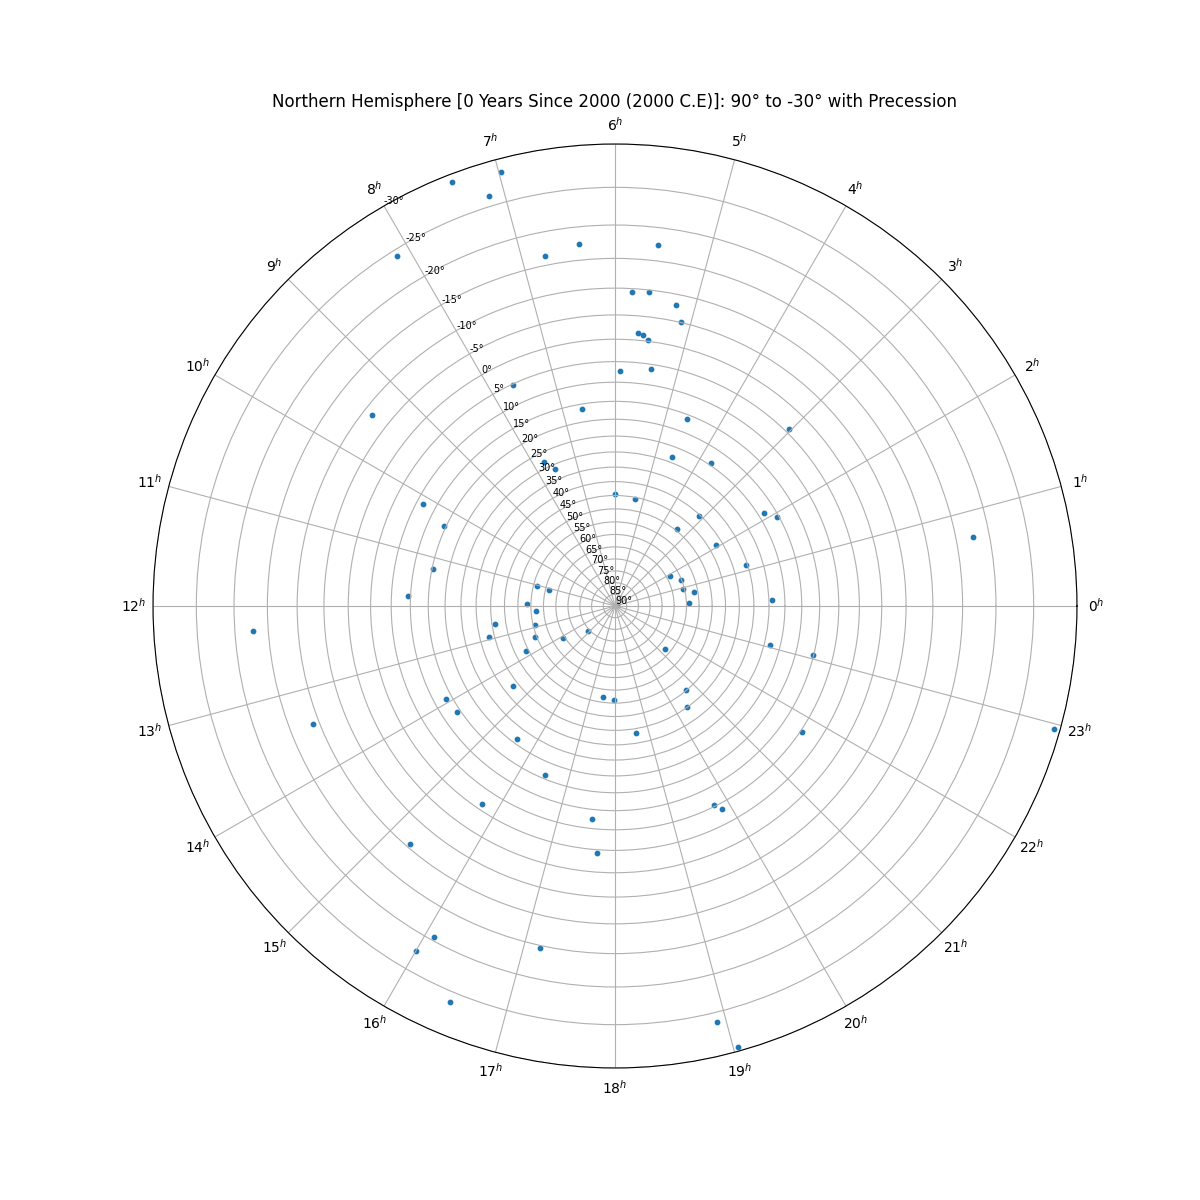
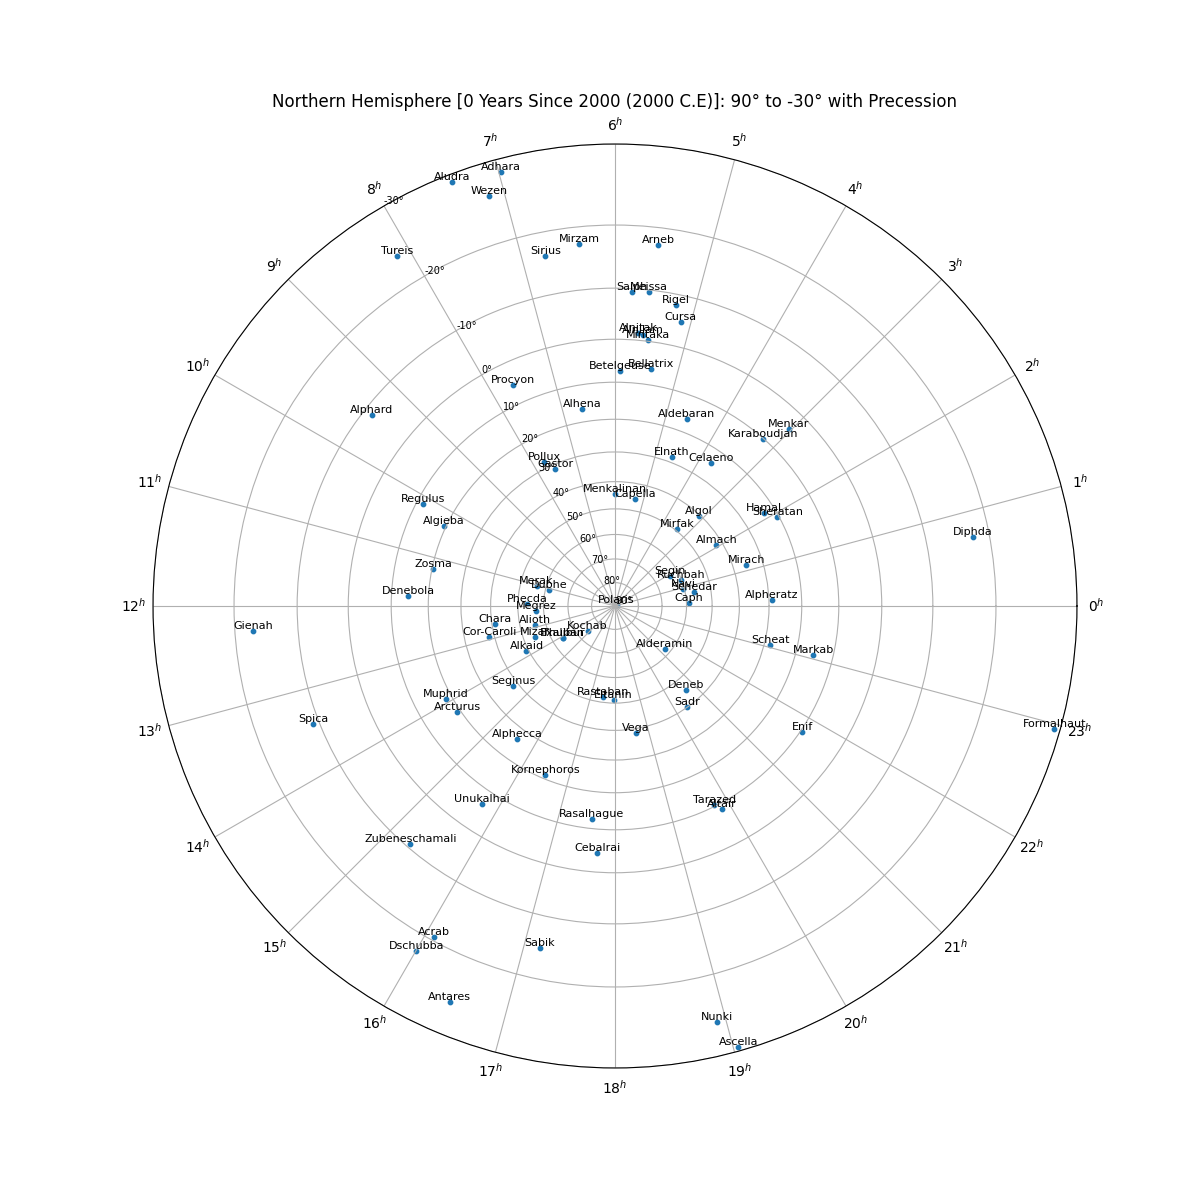
Plot Stars on a Polar Chart
plotStereographicProjection()
Plot stars on a Stereographic Polar Plot
plotStereographicProjection(northOrSouth=None,
			builtInStars=[],
			declination_min=None,
			yearSince2000=0,
			displayStarNamesLabels=True,
			displayDeclinationNumbers=True,
			incrementBy=10,
			isPrecessionIncluded=True,
			maxMagnitudeFilter=None,
			userDefinedStars=[],
			onlyDisplayUserStars=False,
			showPlot=True,
			fig_plot_title=None,
			fig_plot_color="C0",
			figsize_n=12,
			figsize_dpi=100,
			save_plot_name=None)
- [REQUIRED] northOrSouth: (string) map for either the "North" or "South" hemisphere
- [OPTIONAL] builtInStars: (list) a list of star names to include from built-in list, by default = [] includes all stars (in star_data.csv). Example: ["Vega", "Merak", "Dubhe"]
- [OPTIONAL] declination_min: (int/float) outer declination value, defaults to -30° in Northern hemisphere and 30° in Southern hemisphere
- [OPTIONAL] yearSince2000: (int/float) years since 2000 (-50 = 1950 and +50 = 2050) to calculate proper motion and precession, defaults = 0 years
- [OPTIONAL] displayStarNamesLabels: (boolean) display the star name labels, defaults to True
- [OPTIONAL] displayDeclinationNumbers: (boolean) display declination values, defaults to True
- [OPTIONAL] incrementBy: (int) increment values for declination (either 1, 5, 10), defaults to 10
- [OPTIONAL] isPrecessionIncluded: (boolean) when calculating star positions include predictions for precession, defaults to True
- [OPTIONAL] maxMagnitudeFilter: (int/float) filter existing stars by magnitude by setting the max magnitude for the chart to include, defaults to None (shows all stars)
- [OPTIONAL] userDefinedStars: (list) List of newStar objects of stars the user has added
- [OPTIONAL] onlyDisplayUserStars: (bool) Only display the stars defined by the users (userDefinedStars)
- [OPTIONAL] showPlot: (boolean) show plot (triggers plt.show()), useful when generating multiple plots at once in the background, defaults to True
- [OPTIONAL] fig_plot_title: (string) figure title, defaults to "<North/South>ern Hemisphere [ Years Since 2000 (YYYY)]: +/-90° to °"
- [OPTIONAL] fig_plot_color: (string) scatter plot star color, defaults to C0
- [OPTIONAL] figsize_n: (int/float) figure size, default to 12
- [OPTIONAL] figsize_dpi: (int/float) figure DPI, default to 100
- [OPTIONAL] save_plot_name: (string) save plot with a string name, defaults to not saving
Stars that will be included by default when builtInStars = [] (Click to view all)
['Acamar', 'Achernar', 'Acrab', 'Acrux', 'Adhara', 'Aldebaran', 'Alderamin', 'Algieba', 'Algol', 'Alhena', 'Alioth', 'Alkaid', 'Almach', 'Alnair', 'Alnilam', 'Alnitak', 'Alphard', 'Alphecca', 'Alpheratz', 'Altair', 'Aludra', 'Ankaa', 'Antares', 'Arcturus', 'Arneb', 'Ascella', 'Aspidiske', 'Atria', 'Avior', 'Bellatrix', 'Beta Hydri', 'Beta Phoenicis', 'Betelgeuse', 'Canopus', 'Capella', 'Caph', 'Castor', 'Cebalrai', 'Celaeno', 'Chara', 'Cor-Caroli', 'Cursa', 'Delta Crucis', 'Delta Velorum', 'Deneb', 'Denebola', 'Diphda', 'Dschubba', 'Dubhe', 'Elnath', 'Eltanin', 'Enif', 'Formalhaut', 'Gacrux', 'Gamma Phoenicis', 'Gienah', 'Hadar', 'Hamal', 'Kaus Australis', 'Kochab', 'Kornephoros', 'Lesath', 'Markab', 'Megrez', 'Meissa', 'Menkalinan', 'Menkar', 'Menkent', 'Merak', 'Miaplacidus', 'Mimosa', 'Mintaka', 'Mirach', 'Mirfak', 'Mirzam', 'Mizar', 'Muphrid', 'Naos', 'Navi', 'Nunki', 'Peacock', 'Phact', 'Phecda', 'Polaris', 'Pollux', 'Procyon', 'Rasalhague', 'Rastaban', 'Regulus', 'Rigel', 'Ruchbah', 'Sabik', 'Sadr', 'Saiph', 'Sargas', 'Scheat', 'Schedar', 'Segin', 'Seginus', 'Shaula', 'Sheratan', 'Sirius', 'Spica', 'Suhail', 'Tarazed', 'Thuban', 'Tureis', 'Unukalhai', 'Vega', 'Wezen', 'Zosma', 'Zubeneschamali']
 |  |
 |  |
 |  |
 |  |
 |  |
 |  |
 |  |
 |  |
 |  |
 |  |
 |  |
 |  |
 |  |
Return Final Position of Stars
finalPositionOfStars()
Returns a dictionary for the final positions of the stars for a specific year in the format: {'Star Name': {"Declination" : Declination (int), "RA": RA (str)}
finalPositionOfStars(builtInStars=[],
		yearSince2000=0,
		isPrecessionIncluded=True,
		userDefinedStars=[],
		onlyDisplayUserStars=False,
		declination_min=None,
		declination_max=None,
		save_to_csv=None)
- [OPTIONAL] builtInStars: (list) a list of star names to include from built-in list, by default = [] includes all stars (in star_data.csv). Example: ["Vega", "Merak", "Dubhe"]
- [OPTIONAL] yearSince2000: (int/float) years since 2000 (-50 = 1950 and +50 = 2050) to calculate proper motion and precession, defaults = 0 years
- [OPTIONAL] isPrecessionIncluded: (boolean) when calculating star positions include predictions for precession, defaults to True
- [OPTIONAL] userDefinedStars: (list): List of newStar objects of stars the user has added
- [OPTIONAL] onlyDisplayUserStars: (bool) Only include the stars defined by the users (userDefinedStars)
- [OPTIONAL] declination_min: (int/float) set minimum declination value, defaults to -30° in Northern hemisphere and 30° in Southern hemisphere
- [OPTIONAL] declination_max: (int/float) set maximum declination value, defaults to 90° in Northern hemisphere and -90° in Southern hemisphere
- [OPTIONAL] save_to_csv: (string) CSV filename and location to save final star positions with headers ["Star Name", "Right Ascension (HH.MM.SS)", "Declination (DD.SS)"]
Stars that will be included by default when builtInStars = [] (Click to view all)
['Acamar', 'Achernar', 'Acrab', 'Acrux', 'Adhara', 'Aldebaran', 'Alderamin', 'Algieba', 'Algol', 'Alhena', 'Alioth', 'Alkaid', 'Almach', 'Alnair', 'Alnilam', 'Alnitak', 'Alphard', 'Alphecca', 'Alpheratz', 'Altair', 'Aludra', 'Ankaa', 'Antares', 'Arcturus', 'Arneb', 'Ascella', 'Aspidiske', 'Atria', 'Avior', 'Bellatrix', 'Beta Hydri', 'Beta Phoenicis', 'Betelgeuse', 'Canopus', 'Capella', 'Caph', 'Castor', 'Cebalrai', 'Celaeno', 'Chara', 'Cor-Caroli', 'Cursa', 'Delta Crucis', 'Delta Velorum', 'Deneb', 'Denebola', 'Diphda', 'Dschubba', 'Dubhe', 'Elnath', 'Eltanin', 'Enif', 'Formalhaut', 'Gacrux', 'Gamma Phoenicis', 'Gienah', 'Hadar', 'Hamal', 'Kaus Australis', 'Kochab', 'Kornephoros', 'Lesath', 'Markab', 'Megrez', 'Meissa', 'Menkalinan', 'Menkar', 'Menkent', 'Merak', 'Miaplacidus', 'Mimosa', 'Mintaka', 'Mirach', 'Mirfak', 'Mirzam', 'Mizar', 'Muphrid', 'Naos', 'Navi', 'Nunki', 'Peacock', 'Phact', 'Phecda', 'Polaris', 'Pollux', 'Procyon', 'Rasalhague', 'Rastaban', 'Regulus', 'Rigel', 'Ruchbah', 'Sabik', 'Sadr', 'Saiph', 'Sargas', 'Scheat', 'Schedar', 'Segin', 'Seginus', 'Shaula', 'Sheratan', 'Sirius', 'Spica', 'Suhail', 'Tarazed', 'Thuban', 'Tureis', 'Unukalhai', 'Vega', 'Wezen', 'Zosma', 'Zubeneschamali']
Return A Star's Position over Time
starPositionOverTime()
Returns a single star's position over time
starPositionOverTime(builtInStarName=None,
			newStar=None,
			startYearSince2000=None,
			endYearSince2000=None,
			incrementYear=5,
			isPrecessionIncluded=True,
			save_to_csv=None)
- [REQUIRED] builtInStarName: (string) a star name from the built-in list, example:
Vega
- [REQUIRED] newStar: (newStar object) a new star included created from a newStar objct
- [REQUIRED] startYearSince2000: (float/int) start year since 2000 (-50 = 1950 and +50 = 2050) to calculate proper motion and precession, defaults = 0 years
- [REQUIRED] endYearSince2000: (float/int) end year since 2000 (-50 = 1950 and +50 = 2050) to calculate proper motion and precession, defaults = 0 years
- [REQUIRED] incrementYear: (float/int) number of year to increment from start to end by, defaults to
5 years
- [OPTIONAL] isPrecessionIncluded: (boolean) when calculating star positions include predictions for precession, defaults to True
- [OPTIONAL] save_to_csv: (string) CSV filename and location to save star's position over time with headers ["Year", "Declination (DD.SS)", "Right Ascension (HH.MM.SS)", "Right Ascension (radians)"]
Stars Built-in (Click to view all)
['Acamar', 'Achernar', 'Acrab', 'Acrux', 'Adhara', 'Aldebaran', 'Alderamin', 'Algieba', 'Algol', 'Alhena', 'Alioth', 'Alkaid', 'Almach', 'Alnair', 'Alnilam', 'Alnitak', 'Alphard', 'Alphecca', 'Alpheratz', 'Altair', 'Aludra', 'Ankaa', 'Antares', 'Arcturus', 'Arneb', 'Ascella', 'Aspidiske', 'Atria', 'Avior', 'Bellatrix', 'Beta Hydri', 'Beta Phoenicis', 'Betelgeuse', 'Canopus', 'Capella', 'Caph', 'Castor', 'Cebalrai', 'Celaeno', 'Chara', 'Cor-Caroli', 'Cursa', 'Delta Crucis', 'Delta Velorum', 'Deneb', 'Denebola', 'Diphda', 'Dschubba', 'Dubhe', 'Elnath', 'Eltanin', 'Enif', 'Formalhaut', 'Gacrux', 'Gamma Phoenicis', 'Gienah', 'Hadar', 'Hamal', 'Kaus Australis', 'Kochab', 'Kornephoros', 'Lesath', 'Markab', 'Megrez', 'Meissa', 'Menkalinan', 'Menkar', 'Menkent', 'Merak', 'Miaplacidus', 'Mimosa', 'Mintaka', 'Mirach', 'Mirfak', 'Mirzam', 'Mizar', 'Muphrid', 'Naos', 'Navi', 'Nunki', 'Peacock', 'Phact', 'Phecda', 'Polaris', 'Pollux', 'Procyon', 'Rasalhague', 'Rastaban', 'Regulus', 'Rigel', 'Ruchbah', 'Sabik', 'Sadr', 'Saiph', 'Sargas', 'Scheat', 'Schedar', 'Segin', 'Seginus', 'Shaula', 'Sheratan', 'Sirius', 'Spica', 'Suhail', 'Tarazed', 'Thuban', 'Tureis', 'Unukalhai', 'Vega', 'Wezen', 'Zosma', 'Zubeneschamali']
Predict Past and Future Pole Stars
predictPoleStar
Return the North/South Pole star for a given year since 2000
predictPoleStar(yearSince2000=0, northOrSouth="North")
- [REQUIRED] yearSince2000 (int/float): ear since 2000 (-50 = 1950 and +50 = 2050) to calculate proper motion and precession, defaults = 0 years
- [OPTIONAL] northOrSouth (string): North or South Pole where
North = 90° and South = -90°, defaults to North
Plot a Star's Position over Time
plotStarPositionOverTime()
Plot a star's declination and right ascension position over time
plotStarPositionOverTime(builtInStarName=None,
			newStar=None,
			startYearSince2000=None,
			endYearSince2000=None,
			incrementYear=10,
			isPrecessionIncluded=True,
			DecOrRA="D",
			showPlot=True,
			showYearMarker=True,
			fig_plot_title=None,
			fig_plot_color="C0",
			figsize_n=12,
			figsize_dpi=100,
			save_plot_name=None)
- [REQUIRED] builtInStarName: (string) a star name from the built-in list, example:
Vega
- [REQUIRED] newStar: (newStar object) a new star included created from a newStar objct
- [REQUIRED] startYearSince2000: (float/int) start year since 2000 (-50 = 1950 and +50 = 2050) to calculate proper motion and precession, defaults = 0 years
- [REQUIRED] endYearSince2000: (float/int) end year since 2000 (-50 = 1950 and +50 = 2050) to calculate proper motion and precession, defaults = 0 years
- [REQUIRED] DecOrRA: (string) Plot the Declination
D or Right Ascension RA, defaults to D
- [REQUIRED] incrementYear: (float/int) number of year to increment from start to end by, defaults to
10 years
- [OPTIONAL] isPrecessionIncluded: (boolean) when calculating star positions include predictions for precession, defaults to True
- [OPTIONAL] showPlot: (boolean) show plot (triggers plt.show()), useful when generating multiple plots at once in the background, defaults to True
- [OPTIONAL] showYearMarker: (boolean) show dotted line for current year
- [OPTIONAL] fig_plot_title: (string) figure plot title, defaults to
<STAR NAME> <DECLINATION/RA> (<With/Without> Precession) from <START BCE/CE> to <END BCE/CE>, every <YEAR INCREMENT> Years
- [OPTIONAL] fig_plot_color: (string) figure plot color, defaults to blue
C0
- [OPTIONAL] figsize_n: (float/int) figure plot size NxN,
12
- [OPTIONAL] figsize_dpi: (float/int) figure dpi, defaults to
100
- [OPTIONAL] save_plot_name: (string) save plot name and location
Stars Built-in (Click to view all)
['Acamar', 'Achernar', 'Acrab', 'Acrux', 'Adhara', 'Aldebaran', 'Alderamin', 'Algieba', 'Algol', 'Alhena', 'Alioth', 'Alkaid', 'Almach', 'Alnair', 'Alnilam', 'Alnitak', 'Alphard', 'Alphecca', 'Alpheratz', 'Altair', 'Aludra', 'Ankaa', 'Antares', 'Arcturus', 'Arneb', 'Ascella', 'Aspidiske', 'Atria', 'Avior', 'Bellatrix', 'Beta Hydri', 'Beta Phoenicis', 'Betelgeuse', 'Canopus', 'Capella', 'Caph', 'Castor', 'Cebalrai', 'Celaeno', 'Chara', 'Cor-Caroli', 'Cursa', 'Delta Crucis', 'Delta Velorum', 'Deneb', 'Denebola', 'Diphda', 'Dschubba', 'Dubhe', 'Elnath', 'Eltanin', 'Enif', 'Formalhaut', 'Gacrux', 'Gamma Phoenicis', 'Gienah', 'Hadar', 'Hamal', 'Kaus Australis', 'Kochab', 'Kornephoros', 'Lesath', 'Markab', 'Megrez', 'Meissa', 'Menkalinan', 'Menkar', 'Menkent', 'Merak', 'Miaplacidus', 'Mimosa', 'Mintaka', 'Mirach', 'Mirfak', 'Mirzam', 'Mizar', 'Muphrid', 'Naos', 'Navi', 'Nunki', 'Peacock', 'Phact', 'Phecda', 'Polaris', 'Pollux', 'Procyon', 'Rasalhague', 'Rastaban', 'Regulus', 'Rigel', 'Ruchbah', 'Sabik', 'Sadr', 'Saiph', 'Sargas', 'Scheat', 'Schedar', 'Segin', 'Seginus', 'Shaula', 'Sheratan', 'Sirius', 'Spica', 'Suhail', 'Tarazed', 'Thuban', 'Tureis', 'Unukalhai', 'Vega', 'Wezen', 'Zosma', 'Zubeneschamali']
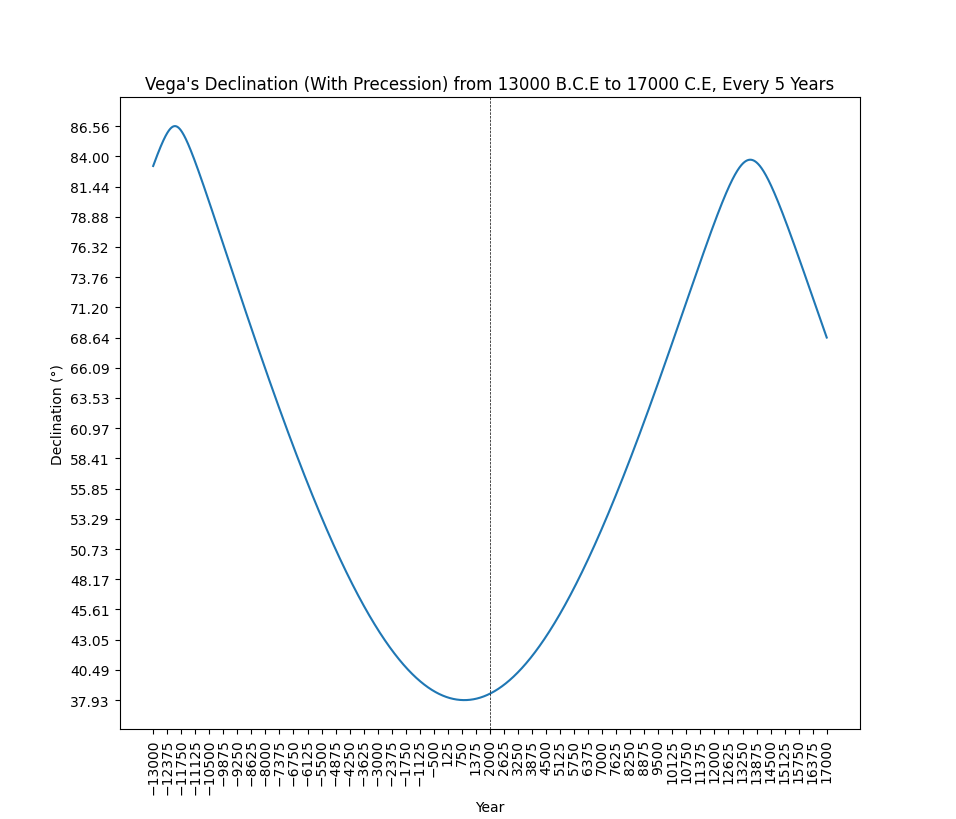
Declination with Precession:
star_chart_spherical_projection.plotStarPositionOverTime(builtInStarName="Vega",
							newStar=None,
							startYearSince2000=-15000,
							endYearSince2000=15000,
							isPrecessionIncluded=True,
							incrementYear=5,
							DecOrRA="D")
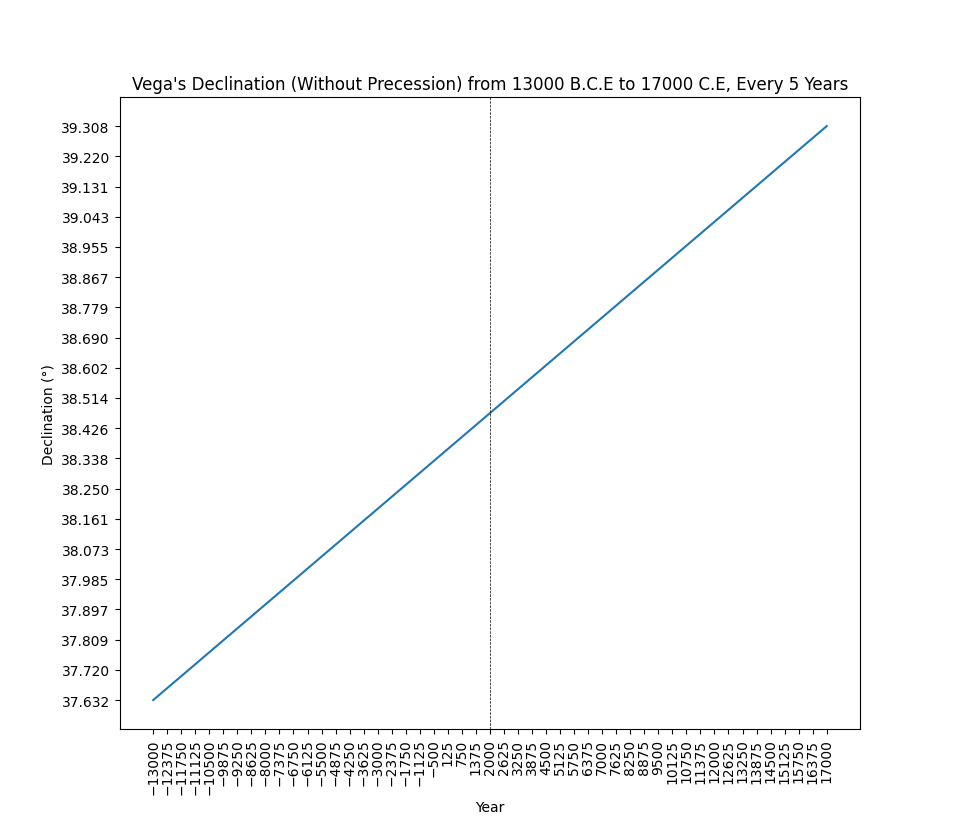
 Declination without Precession:
star_chart_spherical_projection.plotStarPositionOverTime(builtInStarName="Vega",
							newStar=None,
							startYearSince2000=-15000,
							endYearSince2000=15000,
							isPrecessionIncluded=False,
							incrementYear=5,
							DecOrRA="D")
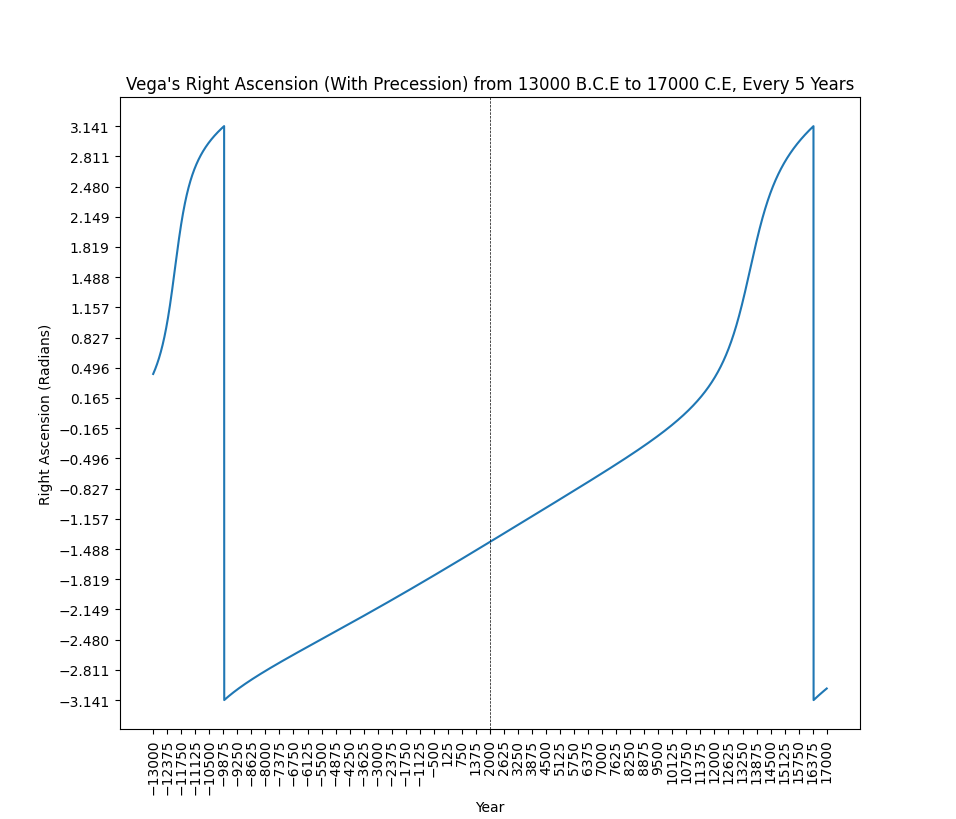
 Right Ascension with Precession:
star_chart_spherical_projection.plotStarPositionOverTime(builtInStarName="Vega",
							newStar=None,
							startYearSince2000=-15000,
							endYearSince2000=15000,
							isPrecessionIncluded=True,
							incrementYear=5,
							DecOrRA="R")
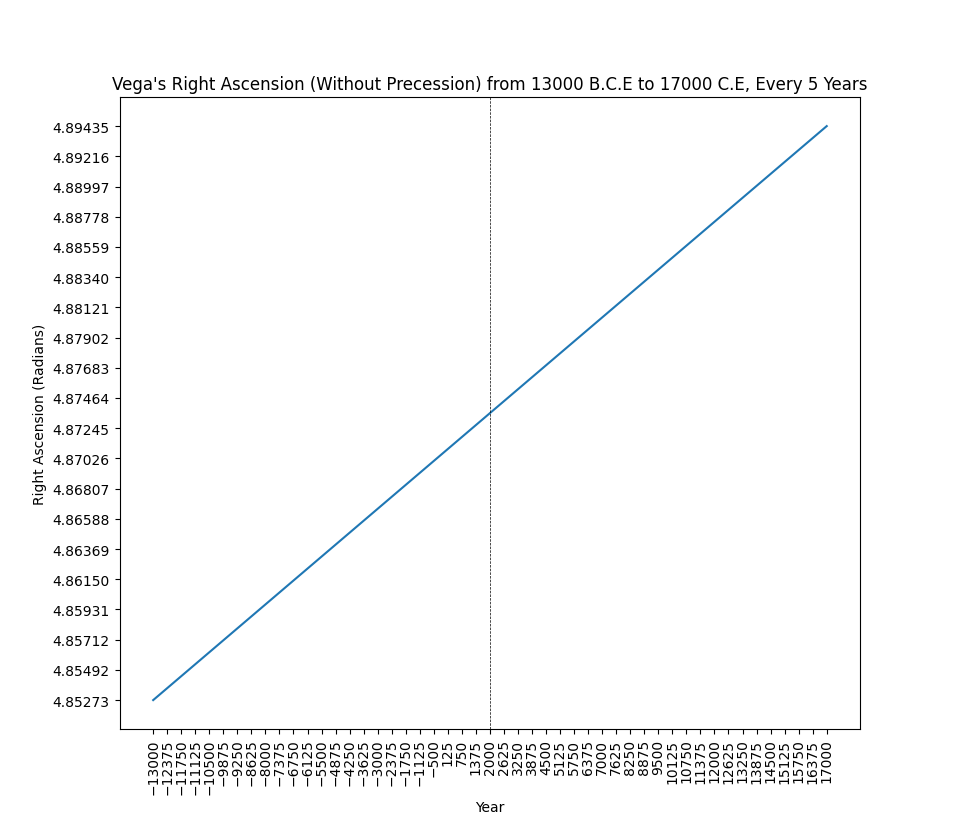
 Right Ascension without Precession:
star_chart_spherical_projection.plotStarPositionOverTime(builtInStarName="Vega",
							newStar=None,
							startYearSince2000=-15000,
							endYearSince2000=15000,
							isPrecessionIncluded=False,
							incrementYear=5,
							DecOrRA="R")
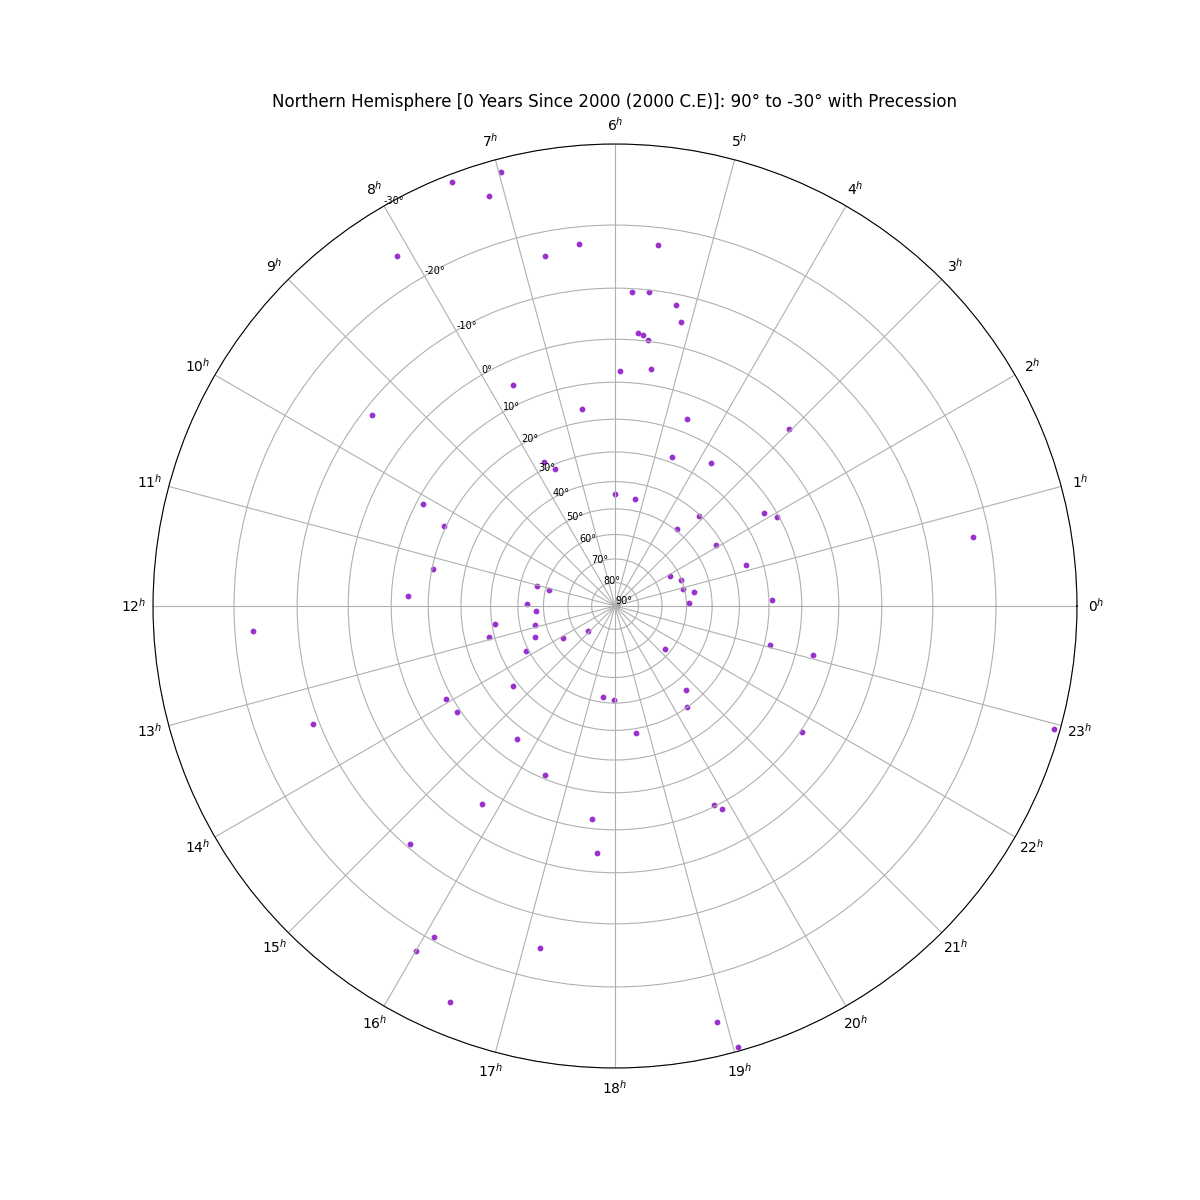
Star Chart Examples:
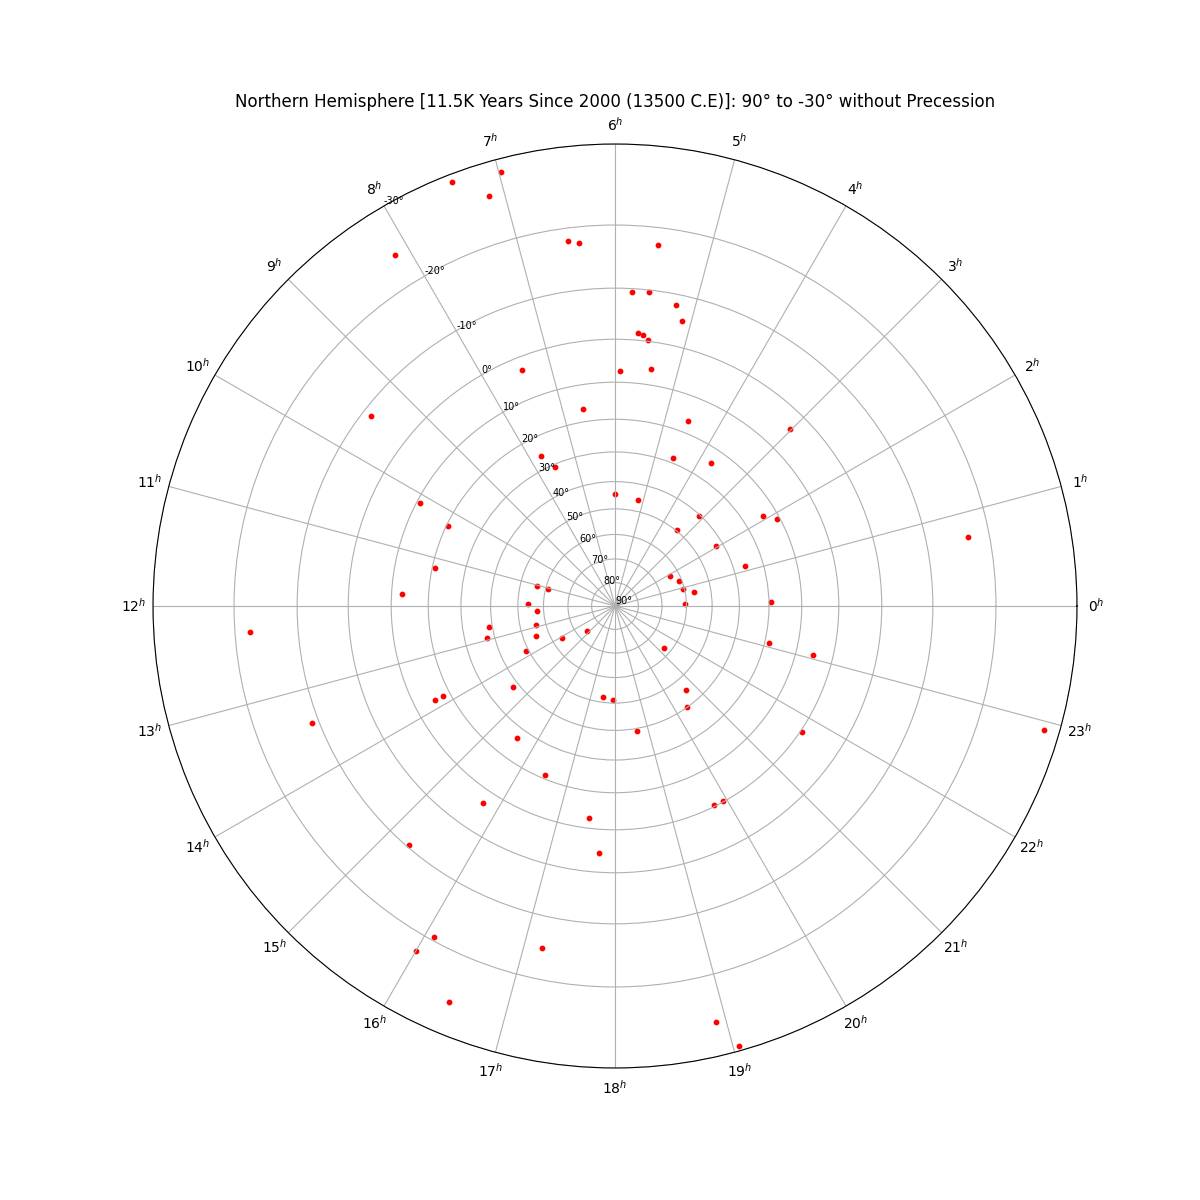
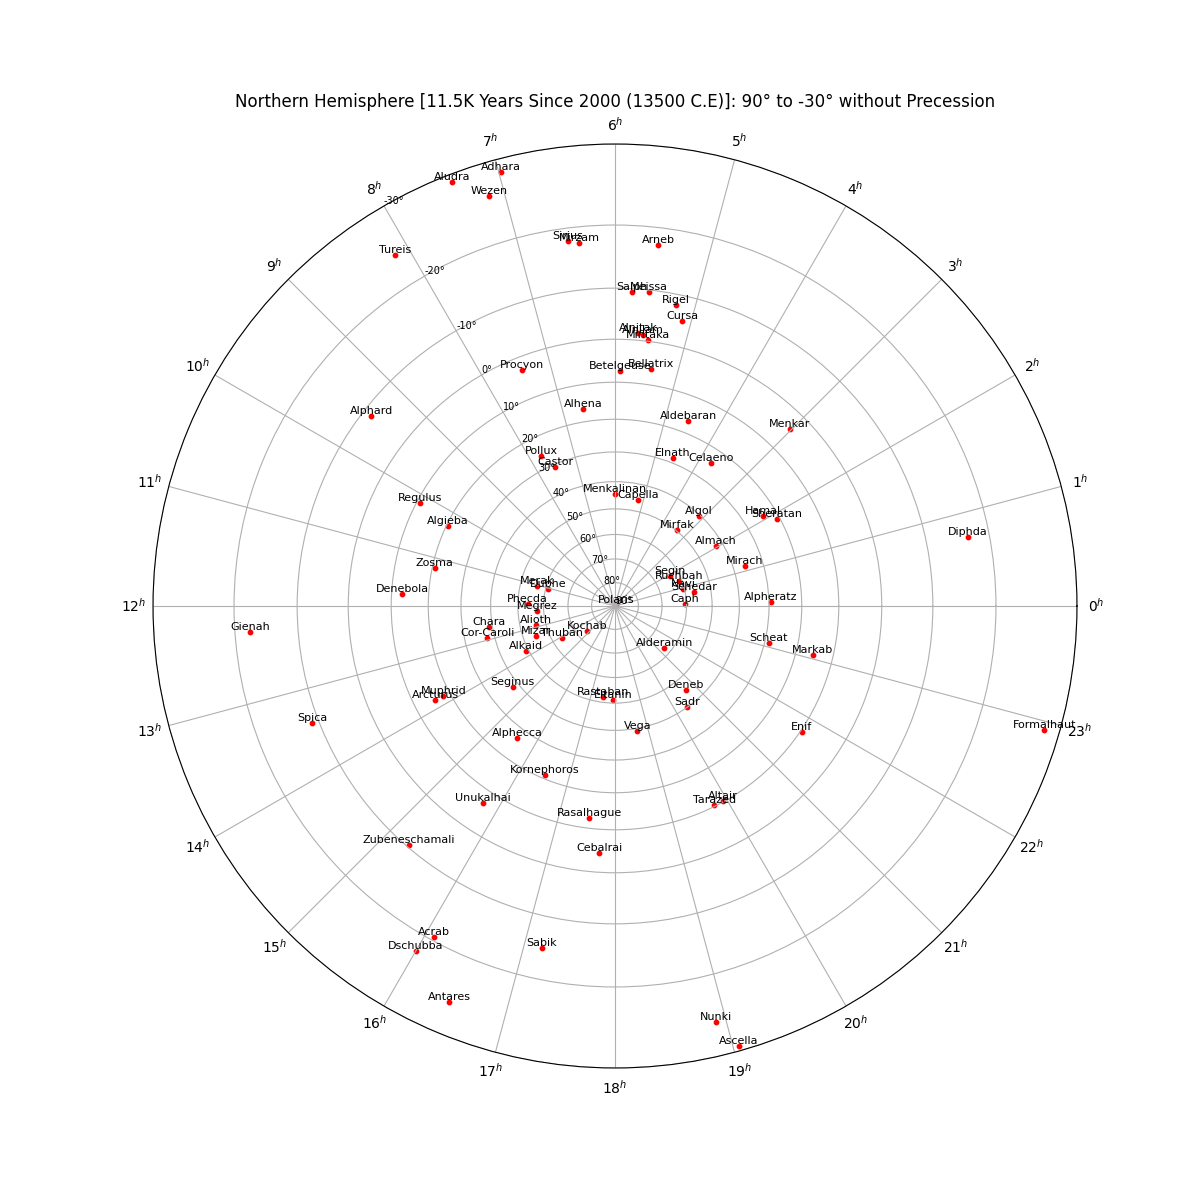
Star Chart in the Northern Hemisphere (centered on 90°) without Precession
star_chart_spherical_projection.plotStereographicProjection(northOrSouth="North",
							displayStarNamesLabels=False,
							yearSince2000=11500,
							isPrecessionIncluded=False,
							fig_plot_color="red")
star_chart_spherical_projection.plotStereographicProjection(northOrSouth="North",
							displayStarNamesLabels=True,
							yearSince2000=11500,
							isPrecessionIncluded=False,
							fig_plot_color="red")
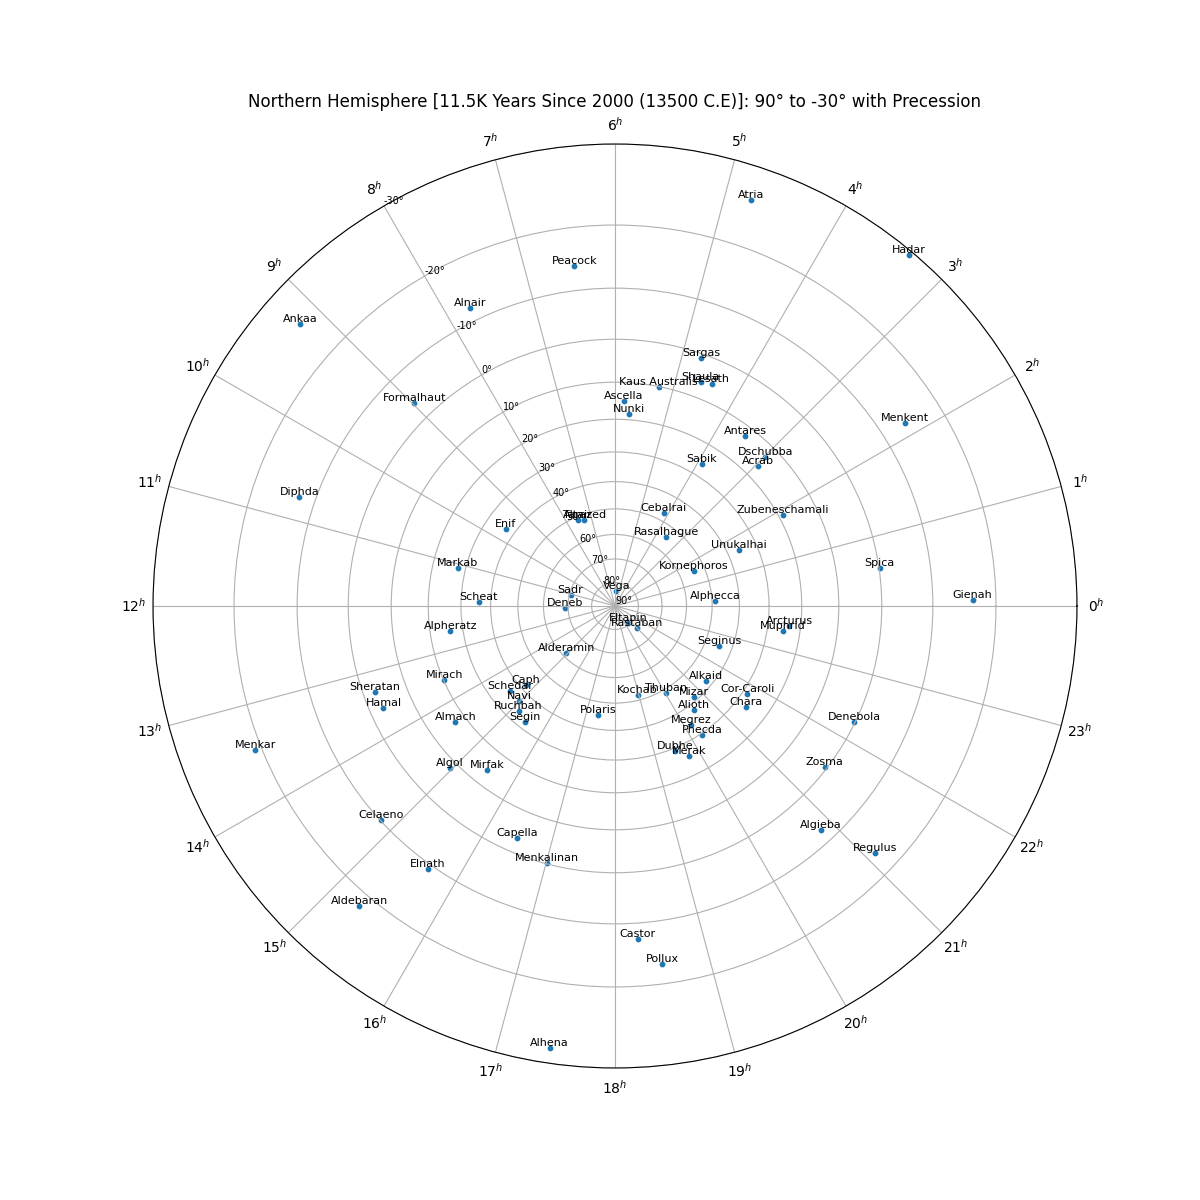
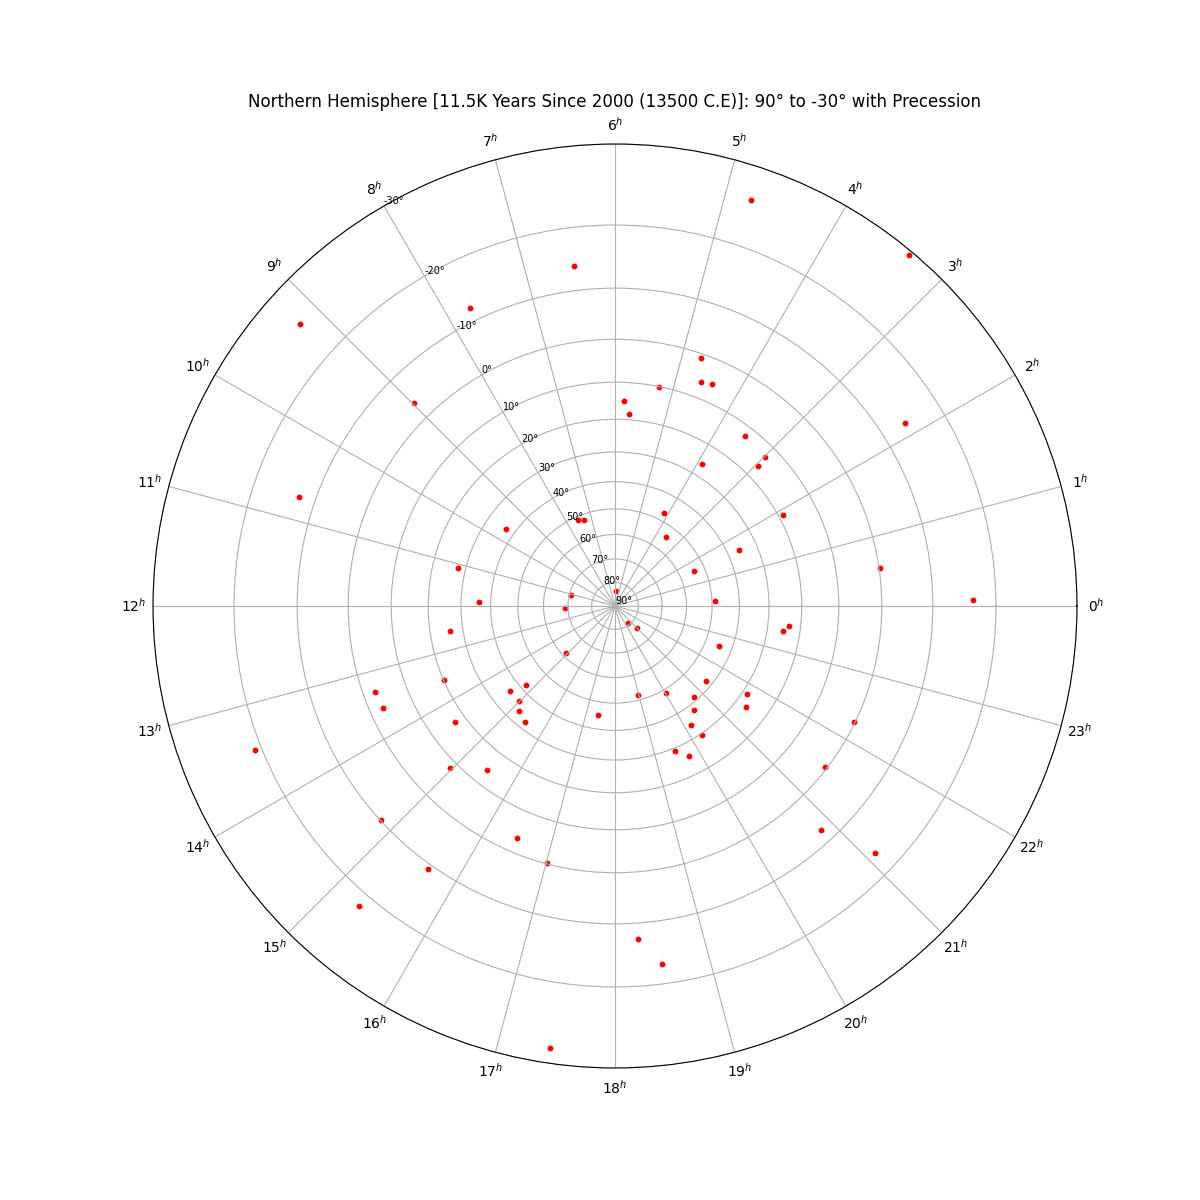
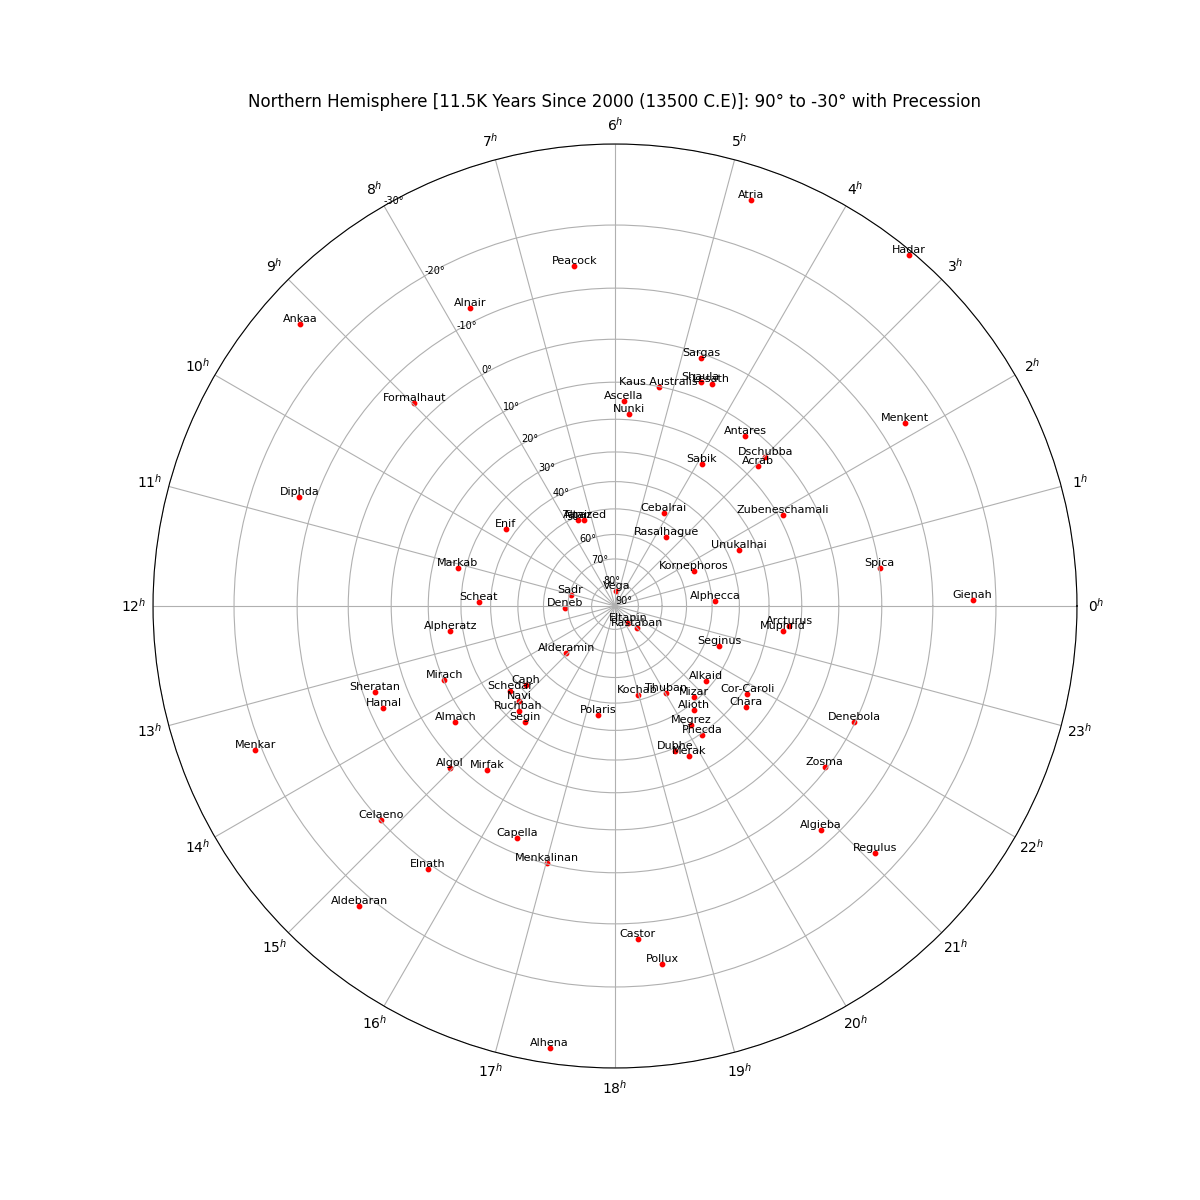
 Star Chart in the Northern Hemisphere (centered on 90°) with Precession
star_chart_spherical_projection.plotStereographicProjection(northOrSouth="North",
							displayStarNamesLabels=False,
							yearSince2000=11500,
							isPrecessionIncluded=True,
							fig_plot_color="red")
star_chart_spherical_projection.plotStereographicProjection(northOrSouth="North",
							displayStarNamesLabels=True,
							yearSince2000=11500,
							isPrecessionIncluded=True,
							fig_plot_color="red")
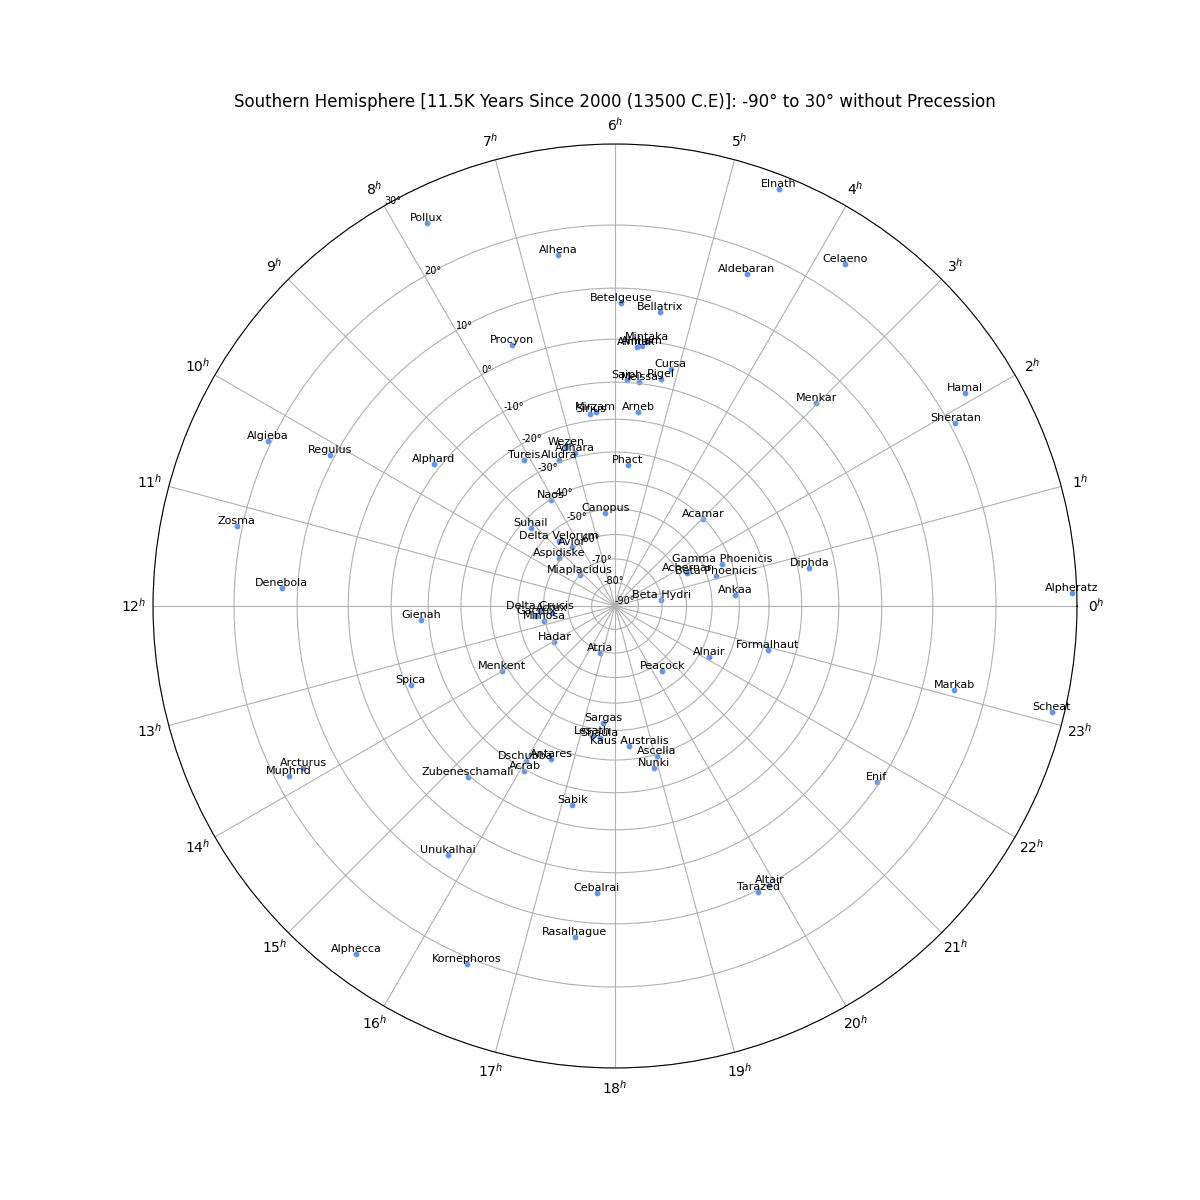
 Star Chart in the Southern Hemisphere (centered on -90°) without Precession
star_chart_spherical_projection.plotStereographicProjection(northOrSouth="South",
							displayStarNamesLabels=False,
							yearSince2000=11500,
							isPrecessionIncluded=False,
							fig_plot_color="cornflowerblue")
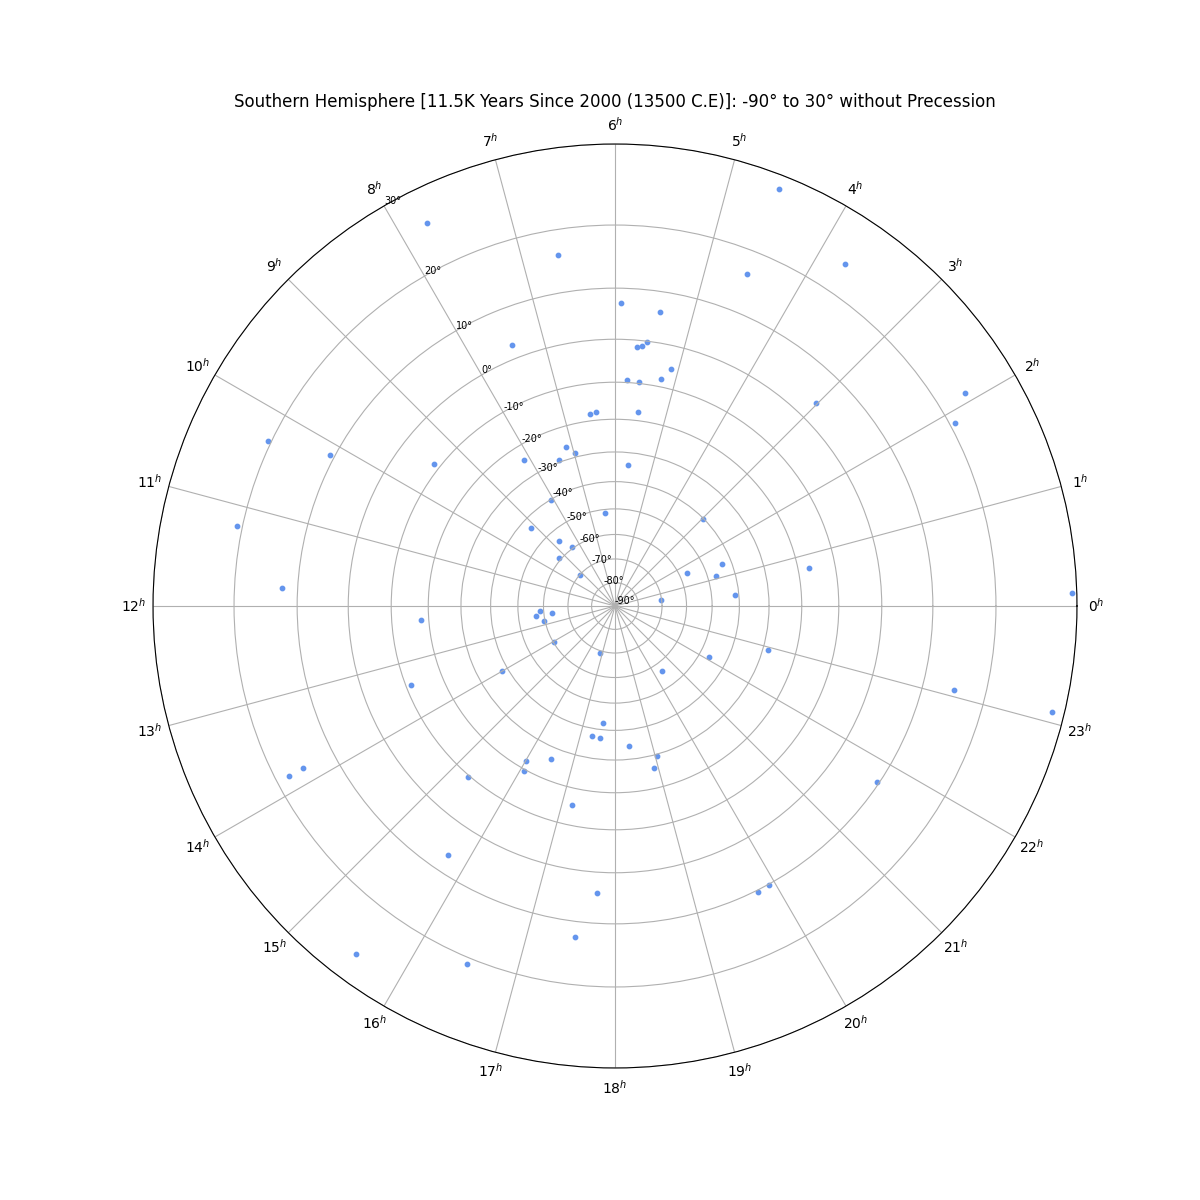
star_chart_spherical_projection.plotStereographicProjection(northOrSouth="South",
							displayStarNamesLabels=True,
							yearSince2000=11500,
							isPrecessionIncluded=False,
							fig_plot_color="cornflowerblue")
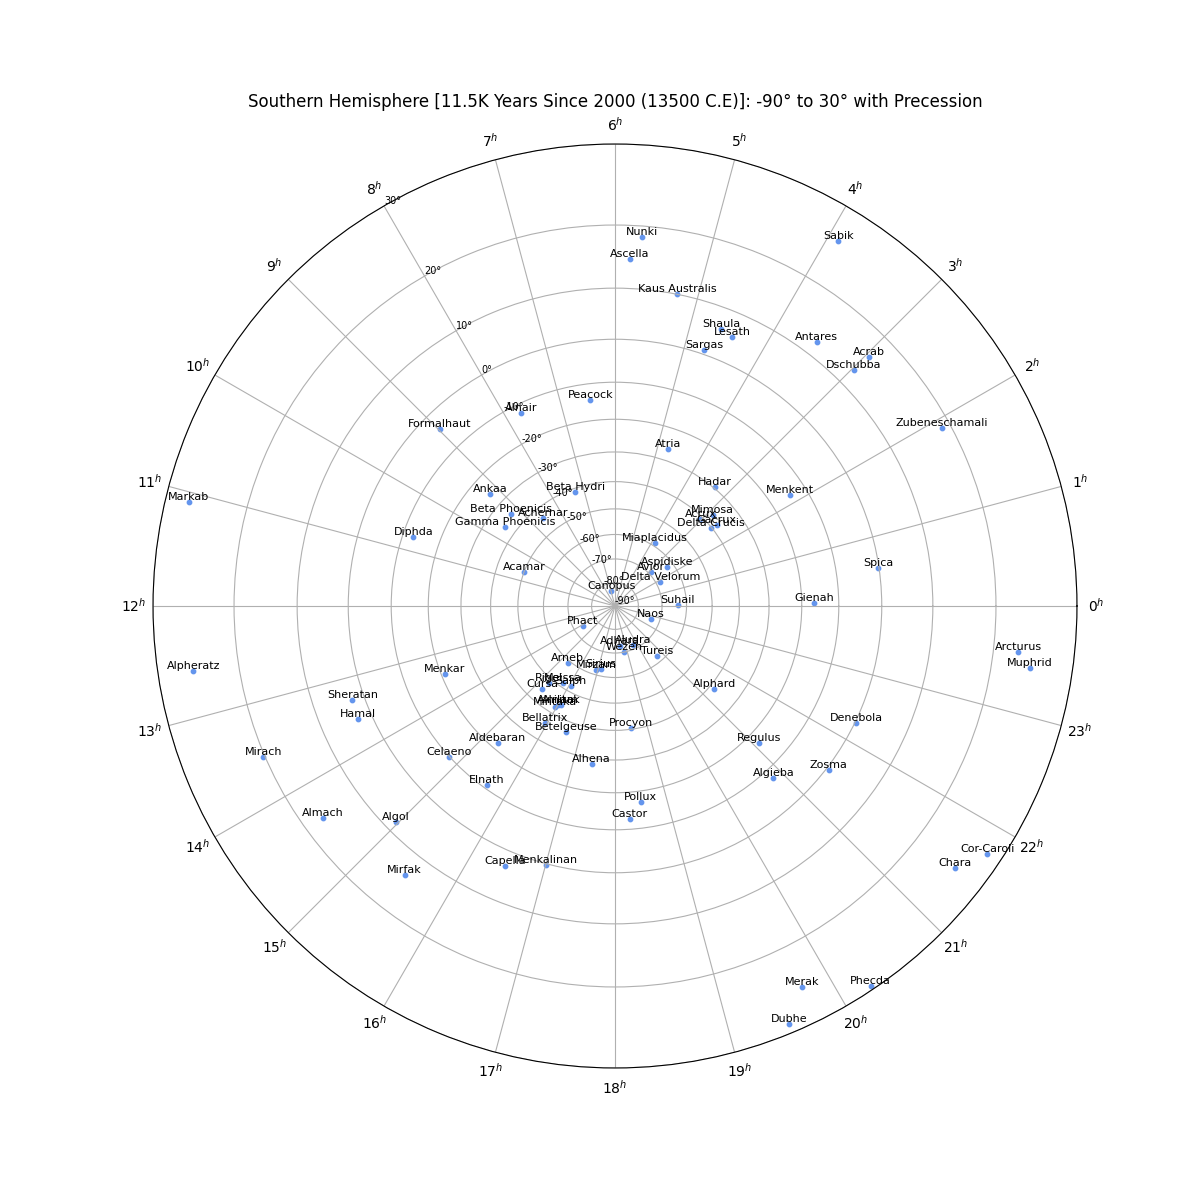
 Star Chart in the Southern Hemisphere (centered on -90°) with Precession
star_chart_spherical_projection.plotStereographicProjection(northOrSouth="South",
							displayStarNamesLabels=False,
							yearSince2000=11500,
							isPrecessionIncluded=True,
							fig_plot_color="cornflowerblue")
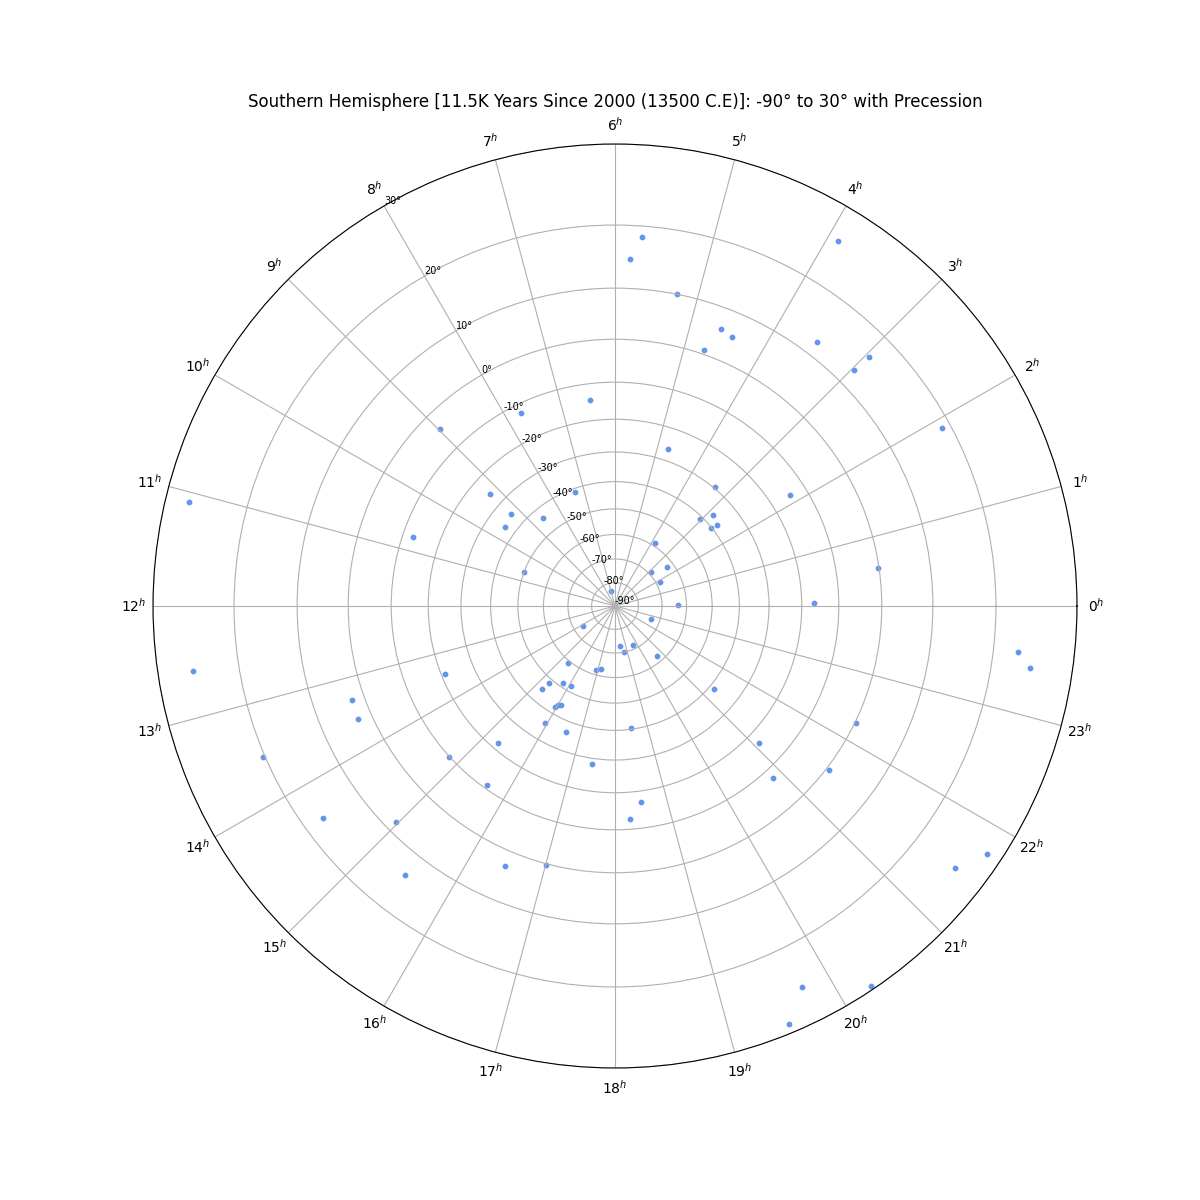
star_chart_spherical_projection.plotStereographicProjection(northOrSouth="South",
							displayStarNamesLabels=True,
							yearSince2000=11500,
							isPrecessionIncluded=True,
							fig_plot_color="cornflowerblue")
Development Environment
To run or test against star-chart-spherical-projection github repo/fork, a development environment can be created via conda/miniconda
First, install Miniconda
Then, using the existing environment.yml, a new conda environment can be create to run/test scripts against
conda env create --file environment.yml
Once the environment has been built, activate the environment:
conda activate star_chart
To run existing and new tests from the root directory:
python -m pytest
Bibliography
Named stars specified by "IAU Catalog of Star Names" with the star position (right ascension and declination) as well as the angle and speed of proper motion from in-the-sky.org and Wikipedia where indicated
Precession model: Vondrák, J., et al. “New Precession Expressions, Valid for Long Time Intervals.” Astronomy & Astrophysics, vol. 534, 2011
Precession code adapted to Python 3+ from the Vondrak long term precession model Github repo 'vondrak')
Bug and Feature Request
Submit a bug fix, question, or feature request as a Github Issue or to cyschneck@gmail.com


