Security News
Astral Launches pyx: A Python-Native Package Registry
Astral unveils pyx, a Python-native package registry in beta, designed to speed installs, enhance security, and integrate deeply with uv.
By Sarah Gooding - Aug 13, 2025
streamlit-lightweight-charts
Advanced tools
Streamlit wrapper for performant Tradingview's Financial: lightweight-charts
The Lightweight Charts library is the best choice to display financial data as an interactive chart on a web page without affecting loading speed and performance.
python -m pip install streamlit-lightweight-charts
from streamlit_lightweight_charts import renderLightweightCharts

renderLightweightCharts(charts: <List of Dicts> , key: <str>)
charts: <List of Dicts>
key: <str> when creating multiple charts in one page

import streamlit as st
from streamlit_lightweight_charts import renderLightweightCharts
import streamlit_lightweight_charts.dataSamples as data

priceVolumeChartOptions = {
    "height": 400,
    "rightPriceScale": {
        "scaleMargins": {
            "top": 0.2,
            "bottom": 0.25,
        },
        "borderVisible": False,
    },
    "overlayPriceScales": {
        "scaleMargins": {
            "top": 0.7,
            "bottom": 0,
        }
    },
    "layout": {
        "background": {
            "type": 'solid',
            "color": '#131722'
        },
        "textColor": '#d1d4dc',
    },
    "grid": {
        "vertLines": {
            "color": 'rgba(42, 46, 57, 0)',
        },
        "horzLines": {
            "color": 'rgba(42, 46, 57, 0.6)',
        }
    }
}

priceVolumeSeries = [
    {
        "type": 'Area',
        "data": data.priceVolumeSeriesArea,
        "options": {
            "topColor": 'rgba(38,198,218, 0.56)',
            "bottomColor": 'rgba(38,198,218, 0.04)',
            "lineColor": 'rgba(38,198,218, 1)',
            "lineWidth": 2,
        }
    },
    {
        "type": 'Histogram',
        "data": data.priceVolumeSeriesHistogram,
        "options": {
            "color": '#26a69a',
            "priceFormat": {
                "type": 'volume',
            },
            "priceScaleId": "" # set as an overlay setting,
        },
        "priceScale": {
            "scaleMargins": {
                "top": 0.7,
                "bottom": 0,
            }
        }
    }
]
st.subheader("Price and Volume Series Chart")

renderLightweightCharts([
    {
        "chart": priceVolumeChartOptions,
        "series": priceVolumeSeries
    }
], 'priceAndVolume')

import streamlit as st
from streamlit_lightweight_charts import renderLightweightCharts
import streamlit_lightweight_charts.dataSamples as data

overlaidAreaSeriesOptions = {
    "height": 400,
    "rightPriceScale": {
        "scaleMargins": {
            "top": 0.1,
            "bottom": 0.1,
        },
        "mode": 2, # PriceScaleMode: 0-Normal, 1-Logarithmic, 2-Percentage, 3-IndexedTo100
        "borderColor": 'rgba(197, 203, 206, 0.4)',
    },
    "timeScale": {
        "borderColor": 'rgba(197, 203, 206, 0.4)',
    },
    "layout": {
        "background": {
            "type": 'solid',
            "color": '#100841'
        },
        "textColor": '#ffffff',
    },
    "grid": {
        "vertLines": {
            "color": 'rgba(197, 203, 206, 0.4)',
            "style": 1, # LineStyle: 0-Solid, 1-Dotted, 2-Dashed, 3-LargeDashed
        },
        "horzLines": {
            "color": 'rgba(197, 203, 206, 0.4)',
            "style": 1, # LineStyle: 0-Solid, 1-Dotted, 2-Dashed, 3-LargeDashed
        }
    }
}

seriesOverlaidChart = [
    {
        "type": 'Area',
        "data": data.seriesMultipleChartArea01,
        "options": {
            "topColor": 'rgba(255, 192, 0, 0.7)',
            "bottomColor": 'rgba(255, 192, 0, 0.3)',
            "lineColor": 'rgba(255, 192, 0, 1)',
            "lineWidth": 2,
        },
        "markers": [
            {
                "time": '2019-04-08',
                "position": 'aboveBar',
                "color": 'rgba(255, 192, 0, 1)',
                "shape": 'arrowDown',
                "text": 'H',
                "size": 3
            },
            {
                "time": '2019-05-13',
                "position": 'belowBar',
                "color": 'rgba(255, 192, 0, 1)',
                "shape": 'arrowUp',
                "text": 'L',
                "size": 3
            },
        ]
    },
    {
        "type": 'Area',
        "data": data.seriesMultipleChartArea02,
        "options": {
            "topColor": 'rgba(67, 83, 254, 0.7)',
            "bottomColor": 'rgba(67, 83, 254, 0.3)',
            "lineColor": 'rgba(67, 83, 254, 1)',
            "lineWidth": 2,
        },
        "markers": [

            {
                "time": '2019-05-03',
                "position": 'aboveBar',
                "color": 'rgba(67, 83, 254, 1)',
                "shape": 'arrowDown',
                "text": 'PEAK',
                "size": 3
            },
        ]
    }
]
st.subheader("Overlaid Series with Markers")

renderLightweightCharts([
    {
        "chart": overlaidAreaSeriesOptions,
        "series": seriesOverlaidChart
    }
], 'overlaid')

import streamlit as st
from streamlit_lightweight_charts import renderLightweightCharts
import streamlit_lightweight_charts.dataSamples as data

chartOptions = {
    "layout": {
        "textColor": 'black',
        "background": {
            "type": 'solid',
            "color": 'white'
        }
    }
}

st.subheader("Data Toggling for an Area Chart")

data_select = st.sidebar.radio('Select data source:', ('Area 01', 'Area 02'))

if data_select == 'Area 01':
    renderLightweightCharts( [
        {
            "chart": chartOptions,
            "series": [{
                "type": 'Area',
                "data": data.seriesMultipleChartArea01,
                "options": {}
            }],
        }
    ], 'area')
else:
    renderLightweightCharts( [
        {
            "chart": chartOptions,
            "series": [{
                "type": 'Area',
                "data": data.seriesMultipleChartArea02,
                "options": {}
            }],
        }
    ], 'area')

import streamlit as st
from streamlit_lightweight_charts import renderLightweightCharts

import json
import numpy as np
import yfinance as yf
import pandas as pd
import pandas_ta as ta

COLOR_BULL = 'rgba(38,166,154,0.9)' # #26a69a
COLOR_BEAR = 'rgba(239,83,80,0.9)'  # #ef5350

# Request historic pricing data via finance.yahoo.com API
df = yf.Ticker('AAPL').history(period='4mo')[['Open', 'High', 'Low', 'Close', 'Volume']]

# Some data wrangling to match required format
df = df.reset_index()
df.columns = ['time','open','high','low','close','volume']                  # rename columns
df['time'] = df['time'].dt.strftime('%Y-%m-%d')                             # Date to string
df['color'] = np.where(  df['open'] > df['close'], COLOR_BEAR, COLOR_BULL)  # bull or bear
df.ta.macd(close='close', fast=6, slow=12, signal=5, append=True)           # calculate macd

# export to JSON format
candles = json.loads(df.to_json(orient = "records"))
volume = json.loads(df.rename(columns={"volume": "value",}).to_json(orient = "records"))
macd_fast = json.loads(df.rename(columns={"MACDh_6_12_5": "value"}).to_json(orient = "records"))
macd_slow = json.loads(df.rename(columns={"MACDs_6_12_5": "value"}).to_json(orient = "records"))
df['color'] = np.where(  df['MACD_6_12_5'] > 0, COLOR_BULL, COLOR_BEAR)  # MACD histogram color
macd_hist = json.loads(df.rename(columns={"MACD_6_12_5": "value"}).to_json(orient = "records"))


chartMultipaneOptions = [
    {
        "width": 600,
        "height": 400,
        "layout": {
            "background": {
                "type": "solid",
                "color": 'white'
            },
            "textColor": "black"
        },
        "grid": {
            "vertLines": {
                "color": "rgba(197, 203, 206, 0.5)"
                },
            "horzLines": {
                "color": "rgba(197, 203, 206, 0.5)"
            }
        },
        "crosshair": {
            "mode": 0
        },
        "priceScale": {
            "borderColor": "rgba(197, 203, 206, 0.8)"
        },
        "timeScale": {
            "borderColor": "rgba(197, 203, 206, 0.8)",
            "barSpacing": 15
        },
        "watermark": {
            "visible": True,
            "fontSize": 48,
            "horzAlign": 'center',
            "vertAlign": 'center',
            "color": 'rgba(171, 71, 188, 0.3)',
            "text": 'AAPL - D1',
        }
    },
    {
        "width": 600,
        "height": 100,
        "layout": {
            "background": {
                "type": 'solid',
                "color": 'transparent'
            },
            "textColor": 'black',
        },
        "grid": {
            "vertLines": {
                "color": 'rgba(42, 46, 57, 0)',
            },
            "horzLines": {
                "color": 'rgba(42, 46, 57, 0.6)',
            }
        },
        "timeScale": {
            "visible": False,
        },
        "watermark": {
            "visible": True,
            "fontSize": 18,
            "horzAlign": 'left',
            "vertAlign": 'top',
            "color": 'rgba(171, 71, 188, 0.7)',
            "text": 'Volume',
        }
    },
    {
        "width": 600,
        "height": 200,
        "layout": {
            "background": {
                "type": "solid",
                "color": 'white'
            },
            "textColor": "black"
        },
        "timeScale": {
            "visible": False,
        },
        "watermark": {
            "visible": True,
            "fontSize": 18,
            "horzAlign": 'left',
            "vertAlign": 'center',
            "color": 'rgba(171, 71, 188, 0.7)',
            "text": 'MACD',
        }
    }
]

seriesCandlestickChart = [
    {
        "type": 'Candlestick',
        "data": candles,
        "options": {
            "upColor": COLOR_BULL,
            "downColor": COLOR_BEAR,
            "borderVisible": False,
            "wickUpColor": COLOR_BULL,
            "wickDownColor": COLOR_BEAR
        }
    }
]

seriesVolumeChart = [
    {
        "type": 'Histogram',
        "data": volume,
        "options": {
            "priceFormat": {
                "type": 'volume',
            },
            "priceScaleId": "" # set as an overlay setting,
        },
        "priceScale": {
            "scaleMargins": {
                "top": 0,
                "bottom": 0,
            },
            "alignLabels": False
        }
    }
]

seriesMACDchart = [
    {
        "type": 'Line',
        "data": macd_fast,
        "options": {
            "color": 'blue',
            "lineWidth": 2
        }
    },
    {
        "type": 'Line',
        "data": macd_slow,
        "options": {
            "color": 'green',
            "lineWidth": 2
        }
    },
    {
        "type": 'Histogram',
        "data": macd_hist,
        "options": {
            "color": 'red',
            "lineWidth": 1
        }
    }
]

st.subheader("Multipane Chart with Pandas")

renderLightweightCharts([
    {
        "chart": chartMultipaneOptions[0],
        "series": seriesCandlestickChart
    },
    {
        "chart": chartMultipaneOptions[1],
        "series": seriesVolumeChart
    },
    {
        "chart": chartMultipaneOptions[2],
        "series": seriesMACDchart
    }
], 'multipane')

import streamlit as st
from streamlit_lightweight_charts import renderLightweightCharts

import json
import numpy as np
import pandas as pd

COLOR_BULL = 'rgba(38,166,154,0.9)' # #26a69a
COLOR_BEAR = 'rgba(239,83,80,0.9)'  # #ef5350

CSVFILE = 'https://github.com/freyastreamlit/streamlit-lightweight-charts/blob/main/examples/MultiPaneChartsFromCSV.csv?raw=true'

df = pd.read_csv(CSVFILE, skiprows=0, parse_dates=['datetime'], skip_blank_lines=True)

df['time'] = df['datetime'].view('int64') // 10**9  # We will use time in UNIX timestamp
df['color'] = np.where(  df['open'] > df['close'], COLOR_BEAR, COLOR_BULL)  # bull or bear

# export to JSON format
candles = json.loads(
    df.filter(['time','open','high','low','close'], axis=1)
      .to_json(orient = "records") )

volume = json.loads(
    df.filter(['time','volume'], axis=1)
      .rename(columns={"volume": "value",})
      .to_json(orient = "records") )

macd_fast = json.loads(
    df.filter(['time','macd_fast'], axis=1)
      .rename(columns={"macd_fast": "value"})
      .to_json(orient = "records"))

macd_slow = json.loads(
    df.filter(['time','macd_slow'], axis=1)
      .rename(columns={"macd_slow": "value"})
      .to_json(orient = "records"))

df['color'] = np.where(  df['macd_hist'] > 0, COLOR_BULL, COLOR_BEAR)  # MACD histogram color
macd_hist = json.loads(
    df.filter(['time','macd_hist'], axis=1)
      .rename(columns={"macd_hist": "value"})
      .to_json(orient = "records"))

chartMultipaneOptions = [
    {
        "width": 600,
        "height": 400,
        "layout": {
            "background": {
                "type": "solid",
                "color": 'white'
            },
            "textColor": "black"
        },
        "grid": {
            "vertLines": {
                "color": "rgba(197, 203, 206, 0.5)"
                },
            "horzLines": {
                "color": "rgba(197, 203, 206, 0.5)"
            }
        },
        "crosshair": {
            "mode": 0
        },
        "priceScale": {
            "borderColor": "rgba(197, 203, 206, 0.8)"
        },
        "timeScale": {
            "borderColor": "rgba(197, 203, 206, 0.8)",
            "barSpacing": 10,
            "minBarSpacing": 8,
            "timeVisible": True,
            "secondsVisible": False,
        },
        "watermark": {
            "visible": True,
            "fontSize": 48,
            "horzAlign": 'center',
            "vertAlign": 'center',
            "color": 'rgba(171, 71, 188, 0.3)',
            "text": 'Intraday',
        }
    },
    {
        "width": 600,
        "height": 100,
        "layout": {
            "background": {
                "type": 'solid',
                "color": 'transparent'
            },
            "textColor": 'black',
        },
        "grid": {
            "vertLines": {
                "color": 'rgba(42, 46, 57, 0)',
            },
            "horzLines": {
                "color": 'rgba(42, 46, 57, 0.6)',
            }
        },
        "timeScale": {
            "visible": False,
        },
        "watermark": {
            "visible": True,
            "fontSize": 18,
            "horzAlign": 'left',
            "vertAlign": 'top',
            "color": 'rgba(171, 71, 188, 0.7)',
            "text": 'Volume',
        }
    },
    {
        "width": 600,
        "height": 200,
        "layout": {
            "background": {
                "type": "solid",
                "color": 'white'
            },
            "textColor": "black"
        },
        "timeScale": {
            "visible": False,
        },
        "watermark": {
            "visible": True,
            "fontSize": 18,
            "horzAlign": 'left',
            "vertAlign": 'center',
            "color": 'rgba(171, 71, 188, 0.7)',
            "text": 'MACD',
        }
    }
]

seriesCandlestickChart = [
    {
        "type": 'Candlestick',
        "data": candles,
        "options": {
            "upColor": COLOR_BULL,
            "downColor": COLOR_BEAR,
            "borderVisible": False,
            "wickUpColor": COLOR_BULL,
            "wickDownColor": COLOR_BEAR
        }
    }
]

seriesVolumeChart = [
    {
        "type": 'Histogram',
        "data": volume,
        "options": {
            "priceFormat": {
                "type": 'volume',
            },
            "priceScaleId": "" # set as an overlay setting,
        },
        "priceScale": {
            "scaleMargins": {
                "top": 0,
                "bottom": 0,
            },
            "alignLabels": False
        }
    }
]

seriesMACDchart = [
    {
        "type": 'Line',
        "data": macd_fast,
        "options": {
            "color": 'blue',
            "lineWidth": 2
        }
    },
    {
        "type": 'Line',
        "data": macd_slow,
        "options": {
            "color": 'green',
            "lineWidth": 2
        }
    },
    {
        "type": 'Histogram',
        "data": macd_hist,
        "options": {
            # "color": 'red',
            "lineWidth": 1
        }
    }
]

st.subheader("Multipane Chart (intraday) from CSV")

renderLightweightCharts([
    {
        "chart": chartMultipaneOptions[0],
        "series": seriesCandlestickChart
    },
    {
        "chart": chartMultipaneOptions[1],
        "series": seriesVolumeChart
    },
    {
        "chart": chartMultipaneOptions[2],
        "series": seriesMACDchart
    }
], 'multipane')

import streamlit as st
from streamlit_lightweight_charts import renderLightweightCharts

chartOptions = {
    "layout": {
        "textColor": 'black',
        "background": {
            "type": 'solid',
            "color": 'white'
        }
    }
}

seriesLineChart = [{
    "type": 'Line',
    "data": [
        { "time": '2018-12-22', "value": 32.51 },
        { "time": '2018-12-23', "value": 31.11 },
        { "time": '2018-12-24', "value": 27.02 },
        { "time": '2018-12-25', "value": 27.32 },
        { "time": '2018-12-26', "value": 25.17 },
        { "time": '2018-12-27', "value": 28.89 },
        { "time": '2018-12-28', "value": 25.46 },
        { "time": '2018-12-29', "value": 23.92 },
        { "time": '2018-12-30', "value": 22.68 },
        { "time": '2018-12-31', "value": 22.67 },
    ],
    "options": {}
}]

st.subheader("Line Chart with Watermark")

renderLightweightCharts([
    {
        "chart": chartOptions,
        "series": seriesLineChart
    }
], 'line')

import streamlit as st
from streamlit_lightweight_charts import renderLightweightCharts

chartOptions = {
    "layout": {
        "textColor": 'black',
        "background": {
            "type": 'solid',
            "color": 'white'
        }
    }
}

seriesAreaChart = [{
    "type": 'Area',
    "data": [
        { "time": '2018-12-22', "value": 32.51 },
        { "time": '2018-12-23', "value": 31.11 },
        { "time": '2018-12-24', "value": 27.02 },
        { "time": '2018-12-25', "value": 27.32 },
        { "time": '2018-12-26', "value": 25.17 },
        { "time": '2018-12-27', "value": 28.89 },
        { "time": '2018-12-28', "value": 25.46 },
        { "time": '2018-12-29', "value": 23.92 },
        { "time": '2018-12-30', "value": 22.68 },
        { "time": '2018-12-31', "value": 22.67 },
    ],
    "options": {}
}]

st.subheader("Area Chart with Watermark")
renderLightweightCharts( [
    {
        "chart": chartOptions,
        "series": seriesAreaChart,
    }
], 'area')

import streamlit as st
from streamlit_lightweight_charts import renderLightweightCharts

chartOptions = {
    "layout": {
        "textColor": 'black',
        "background": {
            "type": 'solid',
            "color": 'white'
        }
    }
}

seriesHistogramChart = [{
    "type": 'Histogram',
    "data": [
        { "value": 1, "time": 1642425322 },
        { "value": 8, "time": 1642511722 },
        { "value": 10, "time": 1642598122 },
        { "value": 20, "time": 1642684522 },
        { "value": 3, "time": 1642770922, "color": 'red' },
        { "value": 43, "time": 1642857322 },
        { "value": 41, "time": 1642943722, "color": 'red' },
        { "value": 43, "time": 1643030122 },
        { "value": 56, "time": 1643116522 },
        { "value": 46, "time": 1643202922, "color": 'red' }
    ],
    "options": { "color": '#26a69a' }
}]

st.subheader("Histogram Chart with Watermark")

renderLightweightCharts([
    {
        "chart": chartOptions,
        "series": seriesHistogramChart
    }
], 'histogram')

import streamlit as st
from streamlit_lightweight_charts import renderLightweightCharts

chartOptions = {
    "layout": {
        "textColor": 'black',
        "background": {
            "type": 'solid',
            "color": 'white'
        }
    }
}

seriesBarChart = [{
    "type": 'Bar',
    "data": [
        { "open": 10, "high": 10.63, "low": 9.49, "close": 9.55, "time": 1642427876 },
        { "open": 9.55, "high": 10.30, "low": 9.42, "close": 9.94, "time": 1642514276 },
        { "open": 9.94, "high": 10.17, "low": 9.92, "close": 9.78, "time": 1642600676 },
        { "open": 9.78, "high": 10.59, "low": 9.18, "close": 9.51, "time": 1642687076 },
        { "open": 9.51, "high": 10.46, "low": 9.10, "close": 10.17, "time": 1642773476 },
        { "open": 10.17, "high": 10.96, "low": 10.16, "close": 10.47, "time": 1642859876 },
        { "open": 10.47, "high": 11.39, "low": 10.40, "close": 10.81, "time": 1642946276 },
        { "open": 10.81, "high": 11.60, "low": 10.30, "close": 10.75, "time": 1643032676 },
        { "open": 10.75, "high": 11.60, "low": 10.49, "close": 10.93, "time": 1643119076 },
        { "open": 10.93, "high": 11.53, "low": 10.76, "close": 10.96, "time": 1643205476 }
    ],
    "options": {
        "upColor": '#26a69a',
        "downColor": '#ef5350'
    }
}]

st.subheader("Bar Chart with Watermark")
renderLightweightCharts([
    {
        "chart": chartOptions,
        "series": seriesBarChart
    }
], 'bar')

import streamlit as st
from streamlit_lightweight_charts import renderLightweightCharts

chartOptions = {
    "layout": {
        "textColor": 'black',
        "background": {
            "type": 'solid',
            "color": 'white'
        }
    }
}

seriesCandlestickChart = [{
    "type": 'Candlestick',
    "data": [
        { "open": 10, "high": 10.63, "low": 9.49, "close": 9.55, "time": 1642427876 },
        { "open": 9.55, "high": 10.30, "low": 9.42, "close": 9.94, "time": 1642514276 },
        { "open": 9.94, "high": 10.17, "low": 9.92, "close": 9.78, "time": 1642600676 },
        { "open": 9.78, "high": 10.59, "low": 9.18, "close": 9.51, "time": 1642687076 },
        { "open": 9.51, "high": 10.46, "low": 9.10, "close": 10.17, "time": 1642773476 },
        { "open": 10.17, "high": 10.96, "low": 10.16, "close": 10.47, "time": 1642859876 },
        { "open": 10.47, "high": 11.39, "low": 10.40, "close": 10.81, "time": 1642946276 },
        { "open": 10.81, "high": 11.60, "low": 10.30, "close": 10.75, "time": 1643032676 },
        { "open": 10.75, "high": 11.60, "low": 10.49, "close": 10.93, "time": 1643119076 },
        { "open": 10.93, "high": 11.53, "low": 10.76, "close": 10.96, "time": 1643205476 }
    ],
    "options": {
        "upColor": '#26a69a',
        "downColor": '#ef5350',
        "borderVisible": False,
        "wickUpColor": '#26a69a',
        "wickDownColor": '#ef5350'
    }
}]

st.subheader("Candlestick Chart with Watermark")

renderLightweightCharts([
    {
        "chart": chartOptions,
        "series": seriesCandlestickChart
    }
], 'candlestick')
import streamlit as st
from streamlit_lightweight_charts import renderLightweightCharts
chartOptions = {
"layout": {
"textColor": 'black',
"background": {
"type": 'solid',
"color": 'white'
}
}
}
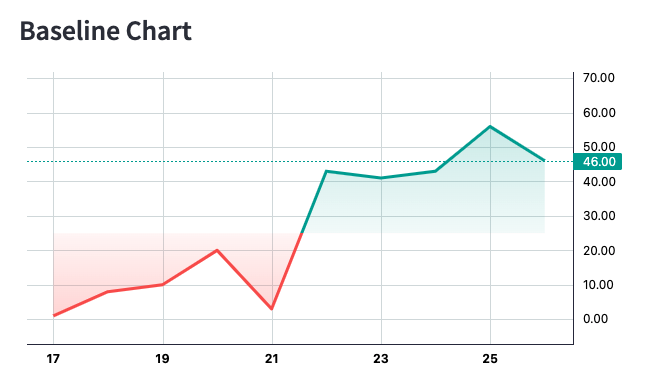
seriesBaselineChart = [{
"type": 'Baseline',
"data": [
{ "value": 1, "time": 1642425322 },
{ "value": 8, "time": 1642511722 },
{ "value": 10, "time": 1642598122 },
{ "value": 20, "time": 1642684522 },
{ "value": 3, "time": 1642770922 },
{ "value": 43, "time": 1642857322 },
{ "value": 41, "time": 1642943722 },
{ "value": 43, "time": 1643030122 },
{ "value": 56, "time": 1643116522 },
{ "value": 46, "time": 1643202922 }
],
"options": {
"baseValue": { "type": "price", "price": 25 },
"topLineColor": 'rgba( 38, 166, 154, 1)',
"topFillColor1": 'rgba( 38, 166, 154, 0.28)',
"topFillColor2": 'rgba( 38, 166, 154, 0.05)',
"bottomLineColor": 'rgba( 239, 83, 80, 1)',
"bottomFillColor1": 'rgba( 239, 83, 80, 0.05)',
"bottomFillColor2": 'rgba( 239, 83, 80, 0.28)'
}
}]
st.subheader("Baseline Chart with Watermark")
renderLightweightCharts([
{
"chart": chartOptions,
"series": seriesBaselineChart
}
], 'baseline')
FAQs
Wrapper for TradingView `lightweight-charts`
We found that streamlit-lightweight-charts demonstrated a healthy version release cadence and project activity because the last version was released less than a year ago. It has 1 open source maintainer collaborating on the project.
Did you know?

Socket for GitHub automatically highlights issues in each pull request and monitors the health of all your open source dependencies. Discover the contents of your packages and block harmful activity before you install or update your dependencies.
Security News
Astral unveils pyx, a Python-native package registry in beta, designed to speed installs, enhance security, and integrate deeply with uv.
Security News
The Latio podcast explores how static and runtime reachability help teams prioritize exploitable vulnerabilities and streamline AppSec workflows.

Security News
The latest Opengrep releases add Apex scanning, precision rule tuning, and performance gains for open source static code analysis.