Research
/Security News
Critical Vulnerability in NestJS Devtools: Localhost RCE via Sandbox Escape
A flawed sandbox in @nestjs/devtools-integration lets attackers run code on your machine via CSRF, leading to full Remote Code Execution (RCE).
This repository stores the new SWIFT/EAGLE/COLIBRE pipeline. The old one is available at this url.
We already have a pipeline; why do we need a new one? The current pipeline suffers from a number of problems.
This has all occurred because at the start of the pipeline project we didn't really know what the scope should be. Now this has become more clear, we are ready to move to a more usable and stable code-base.
To address the above problems, we will create a new 'pipeline' (that effectively borrows all of the code from the old one, just with new 'stitching'). This will aim to:
swift-pipeline, that will take your configuration as arguments to produce
output. This differs from the current situation where the code must be
ran from scripts within one directory.swift-pipeline will contain all of the information required
to entirely re-generate the figures (including ones from 'scripts' like
the star formation history). The API for these additional plotting scripts
will enable us to plot multiple simulation lines on one figure.An example set of configuration files is available in example.
Additional plotting scripts, such as the one used for the density-temperature figure, now should conform to the following API and be runnable as:
python3 my_script.py \
  -s snapshot_0000.hdf5 snapshot_0001.hdf5 ... \ # These may be from different sims
  -c halo_0000.hdf5 halo_0001.hdf5 ... \  # Again different sims
  -d input_directory_one input_directory_two ... \ # Again, different sims
  -n name_one name_two name_three ... \ # Names for different sims (for legend)
  -o output_directory \
  -C config \ # Config directory containing master config.yml (for obs data and stylesheet)
For an example of how to implement this, please see the example in
example/config/scripts.
The pipeline now can be run in two modes:
Both of these produce webpages automatically that include all of the required data.
To run the pipeline, you now need to use a configuration file and directory.
As noted above, one of these is provided in example. This is passed to the pipeline,
which now acts as an executable, in the following way:
swift-pipeline -C ~/config \ # Your configuration directory (customised for sim suite)
  -c example_0000.properties \ # Name of your catalogue file
  -s snapshot_0000.hdf5 \ # Name of your snapshot file
  -i /path/to/your/snapshot \ # Path to snap directory containing properties as well
  -o ~/plots/output \ # Output directory to store HTML, etc. in.
This will then create /path/to/your/snapshot/data_0000.yml. Once you have performed
this for several simulations, you can create a comparison webpage for them using:
swift-pipeline -C ~/config \ # Your configuration directory (customised for sim suite)
  -c example_0000.properties example_0000.properties \ # Name of your catalogue files
  -s snapshot_0000.hdf5 snapshot_0000.hdf5 \ # Name of your snapshot files
  -i /path/to/your/A/snapshot /path/to/your/B/snapshot \ # Path to both directories
  -o ~/plots/output \ # Output directory to store HTML, etc. in.
This elevates the comparisons to being 'first class' citizens - they are treated in the same way as the creation of the 'real' data.
To install the pipeline, you can use the python packaging manager, pip,
pip3 install swiftpipeline
This will make the swift-pipeline executable available.
FAQs
Pipeline for producing galaxy scaling relation plots.
We found that swiftpipeline demonstrated a healthy version release cadence and project activity because the last version was released less than a year ago. It has 2 open source maintainers collaborating on the project.
Did you know?

Socket for GitHub automatically highlights issues in each pull request and monitors the health of all your open source dependencies. Discover the contents of your packages and block harmful activity before you install or update your dependencies.

Research
/Security News
A flawed sandbox in @nestjs/devtools-integration lets attackers run code on your machine via CSRF, leading to full Remote Code Execution (RCE).

Product
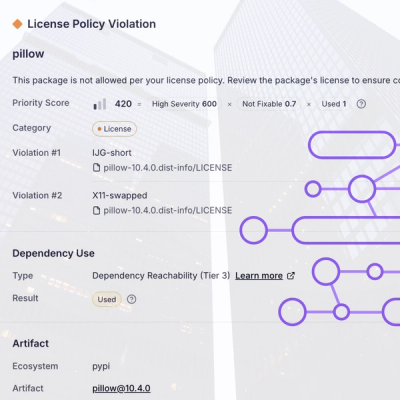
Customize license detection with Socket’s new license overlays: gain control, reduce noise, and handle edge cases with precision.

Product
Socket now supports Rust and Cargo, offering package search for all users and experimental SBOM generation for enterprise projects.