Research
/Security News
Critical Vulnerability in NestJS Devtools: Localhost RCE via Sandbox Escape
A flawed sandbox in @nestjs/devtools-integration lets attackers run code on your machine via CSRF, leading to full Remote Code Execution (RCE).
tensorboard-plugin-profile
Advanced tools
XProf includes a suite of tools for JAX, TensorFlow, and PyTorch/XLA. These tools help you understand, debug and optimize programs to run on CPUs, GPUs and TPUs.
XProf offers a number of tools to analyse and visualize the performance of your model across multiple devices. Some of the tools include:
First time user? Come and check out this Colab Demo.
Note: XProf requires access to the Internet to load the Google Chart library. Some charts and tables may be missing if you run TensorBoard entirely offline on your local machine, behind a corporate firewall, or in a datacenter.
To profile on a single GPU system, the following NVIDIA software must be installed on your system:
NVIDIA GPU drivers and CUDA Toolkit:
Ensure that CUPTI 10.1 exists on the path.
$ /sbin/ldconfig -N -v $(sed 's/:/ /g' <<< $LD_LIBRARY_PATH) | grep libcupti
If you don't see libcupti.so.12.5 on the path, prepend its installation
directory to the $LD_LIBRARY_PATH environmental variable:
$ export LD_LIBRARY_PATH=/usr/local/cuda/extras/CUPTI/lib64:$LD_LIBRARY_PATH
Run the ldconfig command above again to verify that the CUPTI 12.5 library is found.
If this doesn't work, try:
$ sudo apt-get install libcupti-dev
To profile a system with multiple GPUs, see this guide for details.
To profile multi-worker GPU configurations, profile individual workers independently.
To profile cloud TPUs, you must have access to Google Cloud TPUs.
In order to get the latest version of the profiler plugin, you can install the nightly package.
To install the nightly version of profiler:
$ pip uninstall xprof
$ pip install xprof-nightly
Without TensorBoard:
$ xprof --logdir=profiler/demo --port=6006
With TensorBoard:
$ tensorboard --logdir=profiler/demo
If you are behind a corporate firewall, you may need to include the --bind_all
tensorboard flag.
Go to localhost:6006/#profile of your browser, you should now see the demo
overview page show up.
Congratulations! You're now ready to capture a profile.
FAQs
XProf Profiler Plugin
We found that tensorboard-plugin-profile demonstrated a healthy version release cadence and project activity because the last version was released less than a year ago. It has 1 open source maintainer collaborating on the project.
Did you know?

Socket for GitHub automatically highlights issues in each pull request and monitors the health of all your open source dependencies. Discover the contents of your packages and block harmful activity before you install or update your dependencies.

Research
/Security News
A flawed sandbox in @nestjs/devtools-integration lets attackers run code on your machine via CSRF, leading to full Remote Code Execution (RCE).

Product
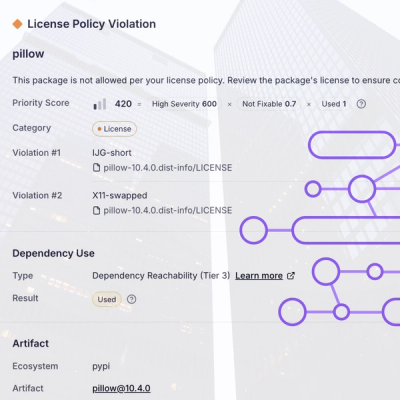
Customize license detection with Socket’s new license overlays: gain control, reduce noise, and handle edge cases with precision.

Product
Socket now supports Rust and Cargo, offering package search for all users and experimental SBOM generation for enterprise projects.