Terminal-plot for Tensorboard


A plotter for tensorboard, directly within your terminal. This is useful when you are training your neural network on a remote server, and you just want to quickly peek at the training curve without launching a tensorboard instance and mess with forwarding ports.
Install
You can install the package published in PyPI with
$ pip install tensorboard-termplot
Usage
$ tensorboard-termplot FOLDER
For example,
$ tensorboard-termplot ~/my_amazing_nn/runs
where runs is the folder that tensorboard had created.
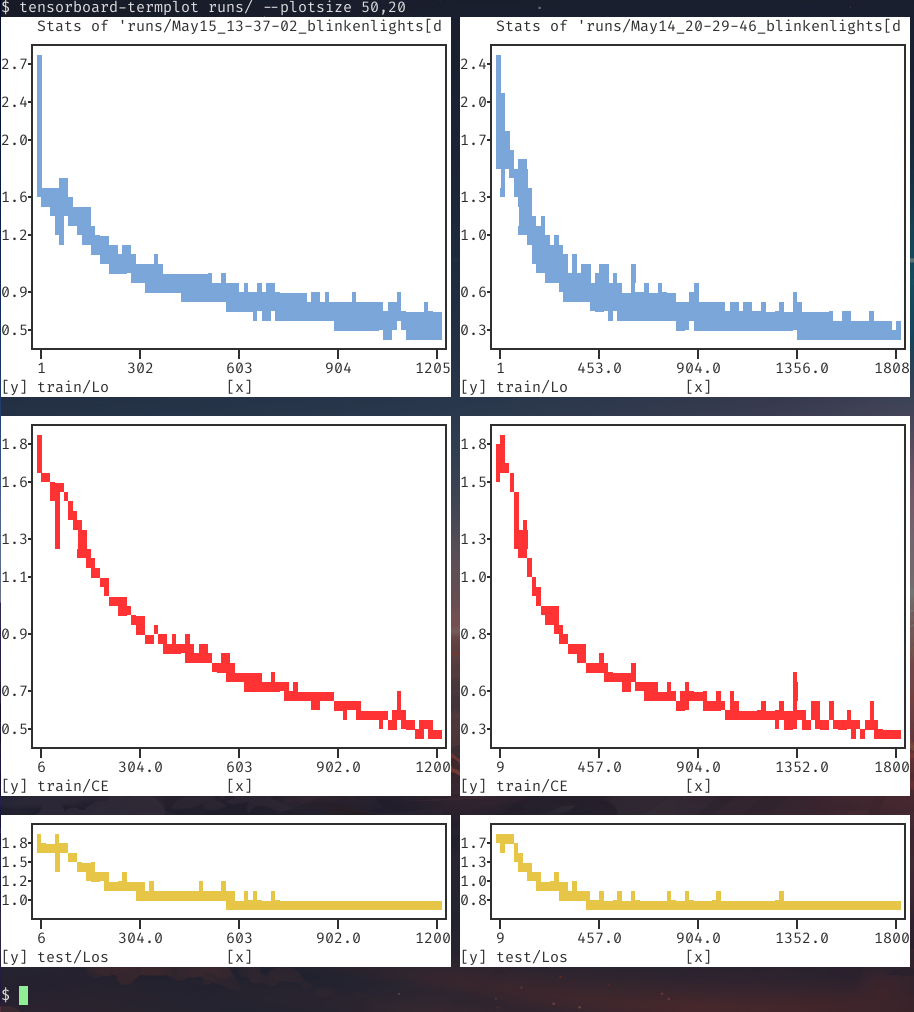
Example
Running the executable on a tensorboard output folder:
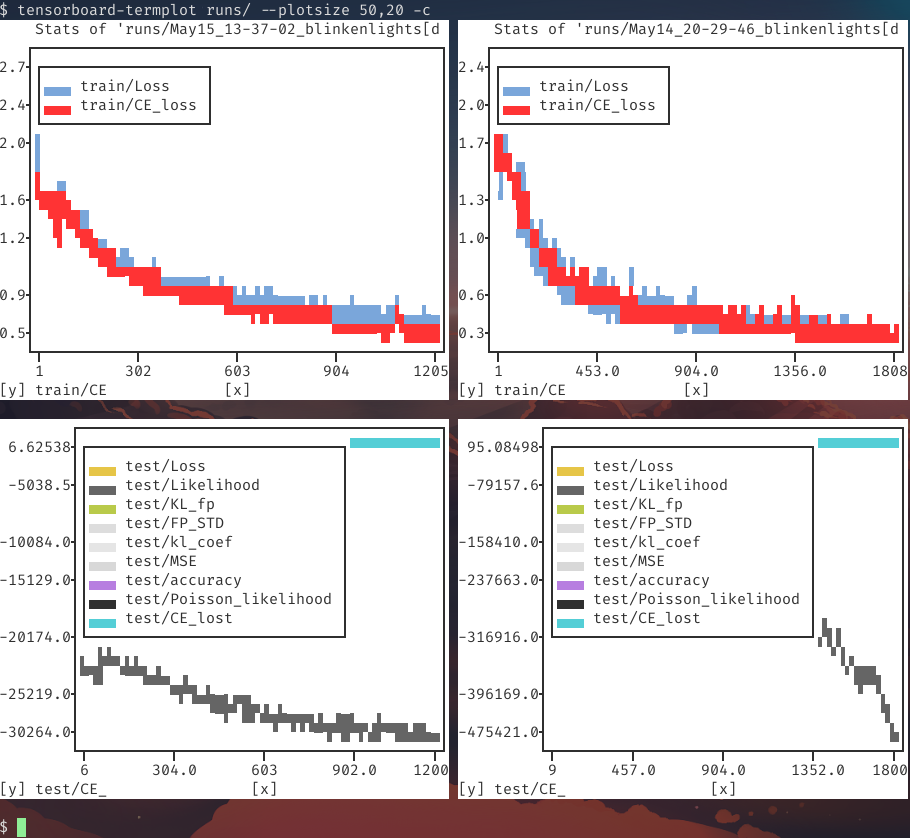
Or with the consolidate flag -c/--consolidate to combine multiple stats with a common prefix (most stats in the bottom figure had empty values):
Help
$ tensorboard-termplot --help
usage: tensorboard-termplot [-h] [--canvas-color CANVAS_COLOR]
                            [--axes-color AXES_COLOR]
                            [--ticks-color TICKS_COLOR] [--colorless] [-d]
                            [--grid] [--plotsize WIDTH,HEIGHT] [--force-label]
                            [--no-iter-color] [-c] [-f] [-n secs]
                            [--log_interval LOG_INTERVAL]
                            FOLDER

positional arguments:
  FOLDER                Folder of a tensorboard runs

optional arguments:
  -h, --help            show this help message and exit
  --canvas-color CANVAS_COLOR
                        set the color of the plot canvas (the area where the
                        data is plotted)
  --axes-color AXES_COLOR
                        sets the background color of all the labels
                        surrounding the actual plot, i.e. the axes, axes
                        labels and ticks, title and legend, if present
  --ticks-color TICKS_COLOR
                        sets the (full-ground) color of the axes ticks and of
                        the grid lines.
  --colorless           Remove color.
  -d, --dark-theme      A collection of flags. If set, it is equivalent to
                        setting canvas-color and axes-color to black, and
                        setting ticks-color to red. Can be overwritten
                        individually.
  --grid                Show grid.
  --plotsize WIDTH,HEIGHT
                        Manually set the size of each subplot, e.g., 50,20.
  --force-label         Force showing label even for plot with one series.
  --no-iter-color       Stop iterating through different colors per plot.
  -c, --consolidate     Consolidate based on prefix.
  -f, --follow          Run in a loop to update display periodic.
  -n secs, --interval secs
                        seconds to wait between updates


