Product
Introducing Socket Fix for Safe, Automated Dependency Upgrades
Automatically fix and test dependency updates with socket fix—a new CLI tool that turns CVE alerts into safe, automated upgrades.
testrail-api-reporter
Advanced tools
This package contains several tools to interact with TestRail via API.
General part is TestRailResultsReporter, which is designed to report test results via api. This part is close to trcli, but without nasty bugs.
Firstly, you need to obtain test results in xml format. You can do it via running your testsuite, i.e. using pytest:
pytest --junitxml "junit-report.xml" "./tests"
Also, you need to add custom field (string type) to TestRails with name automation_id.
Now, you ready to upload results to TestRails. To it, use:
url='https://your_tr.testrail.io'
email='your@email.com'
password='your_password'
project_number=42
test_suite_number=66
api=TestRailResultsReporter(url=url, email=email, password=password, project_id=project_id,
                            suite_id=test_suite_id, xml_report='junit-report.xml')
# then just call:
api.send_results()
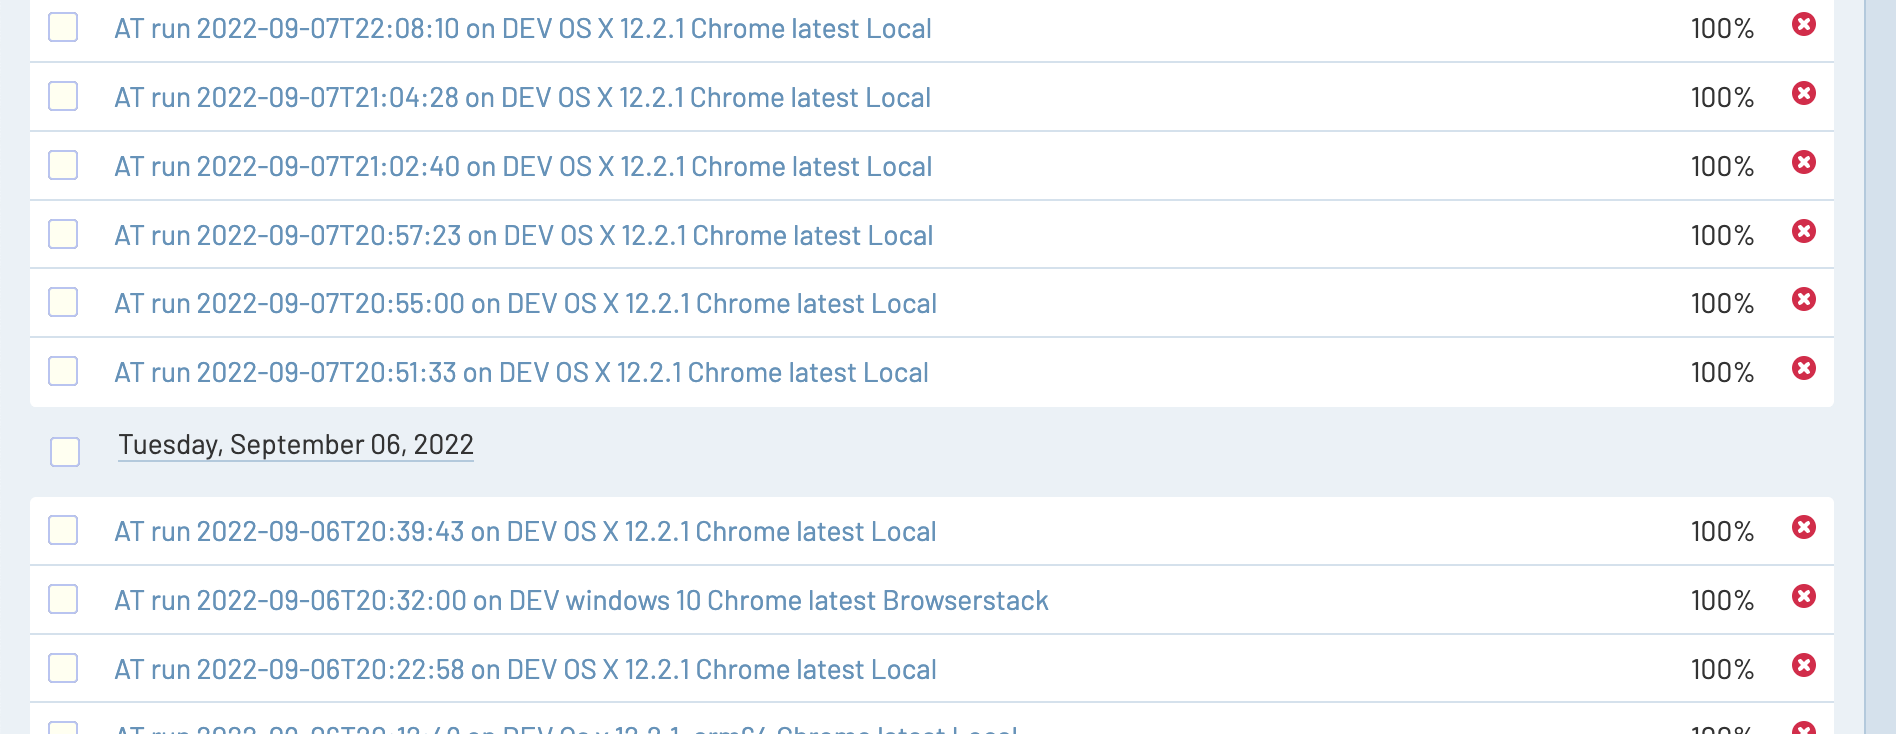
After this new testcases, test run and test results will be created. Testrun will have a name like
AT run 2022-09-01T20:25:51
If you fill automation_id for existing testcases using correct format
path.to.testfile.filename.test_class.test_step, then in such case results will be added to existing testcases.
Also, you can customize test run by passing:
title param to send_results function - it will replace whole test run title.environment - it will be added to end of string like AT run 2022-09-01T20:25:51 on Devtimestamp - it will replace timestamp, obtained from XML file)run_id - if specified, results will be added to test run, no new testrun will be createdclose_run - may be True (by default) or False - if True, then every testrun will be closedrun_name - you may use run name (title) instead of it's ID, in this case run id will be ignored even if it's filleddelete_old_run - may be True or False (by default) - if True, then specified testrun will be deleted and new one will be created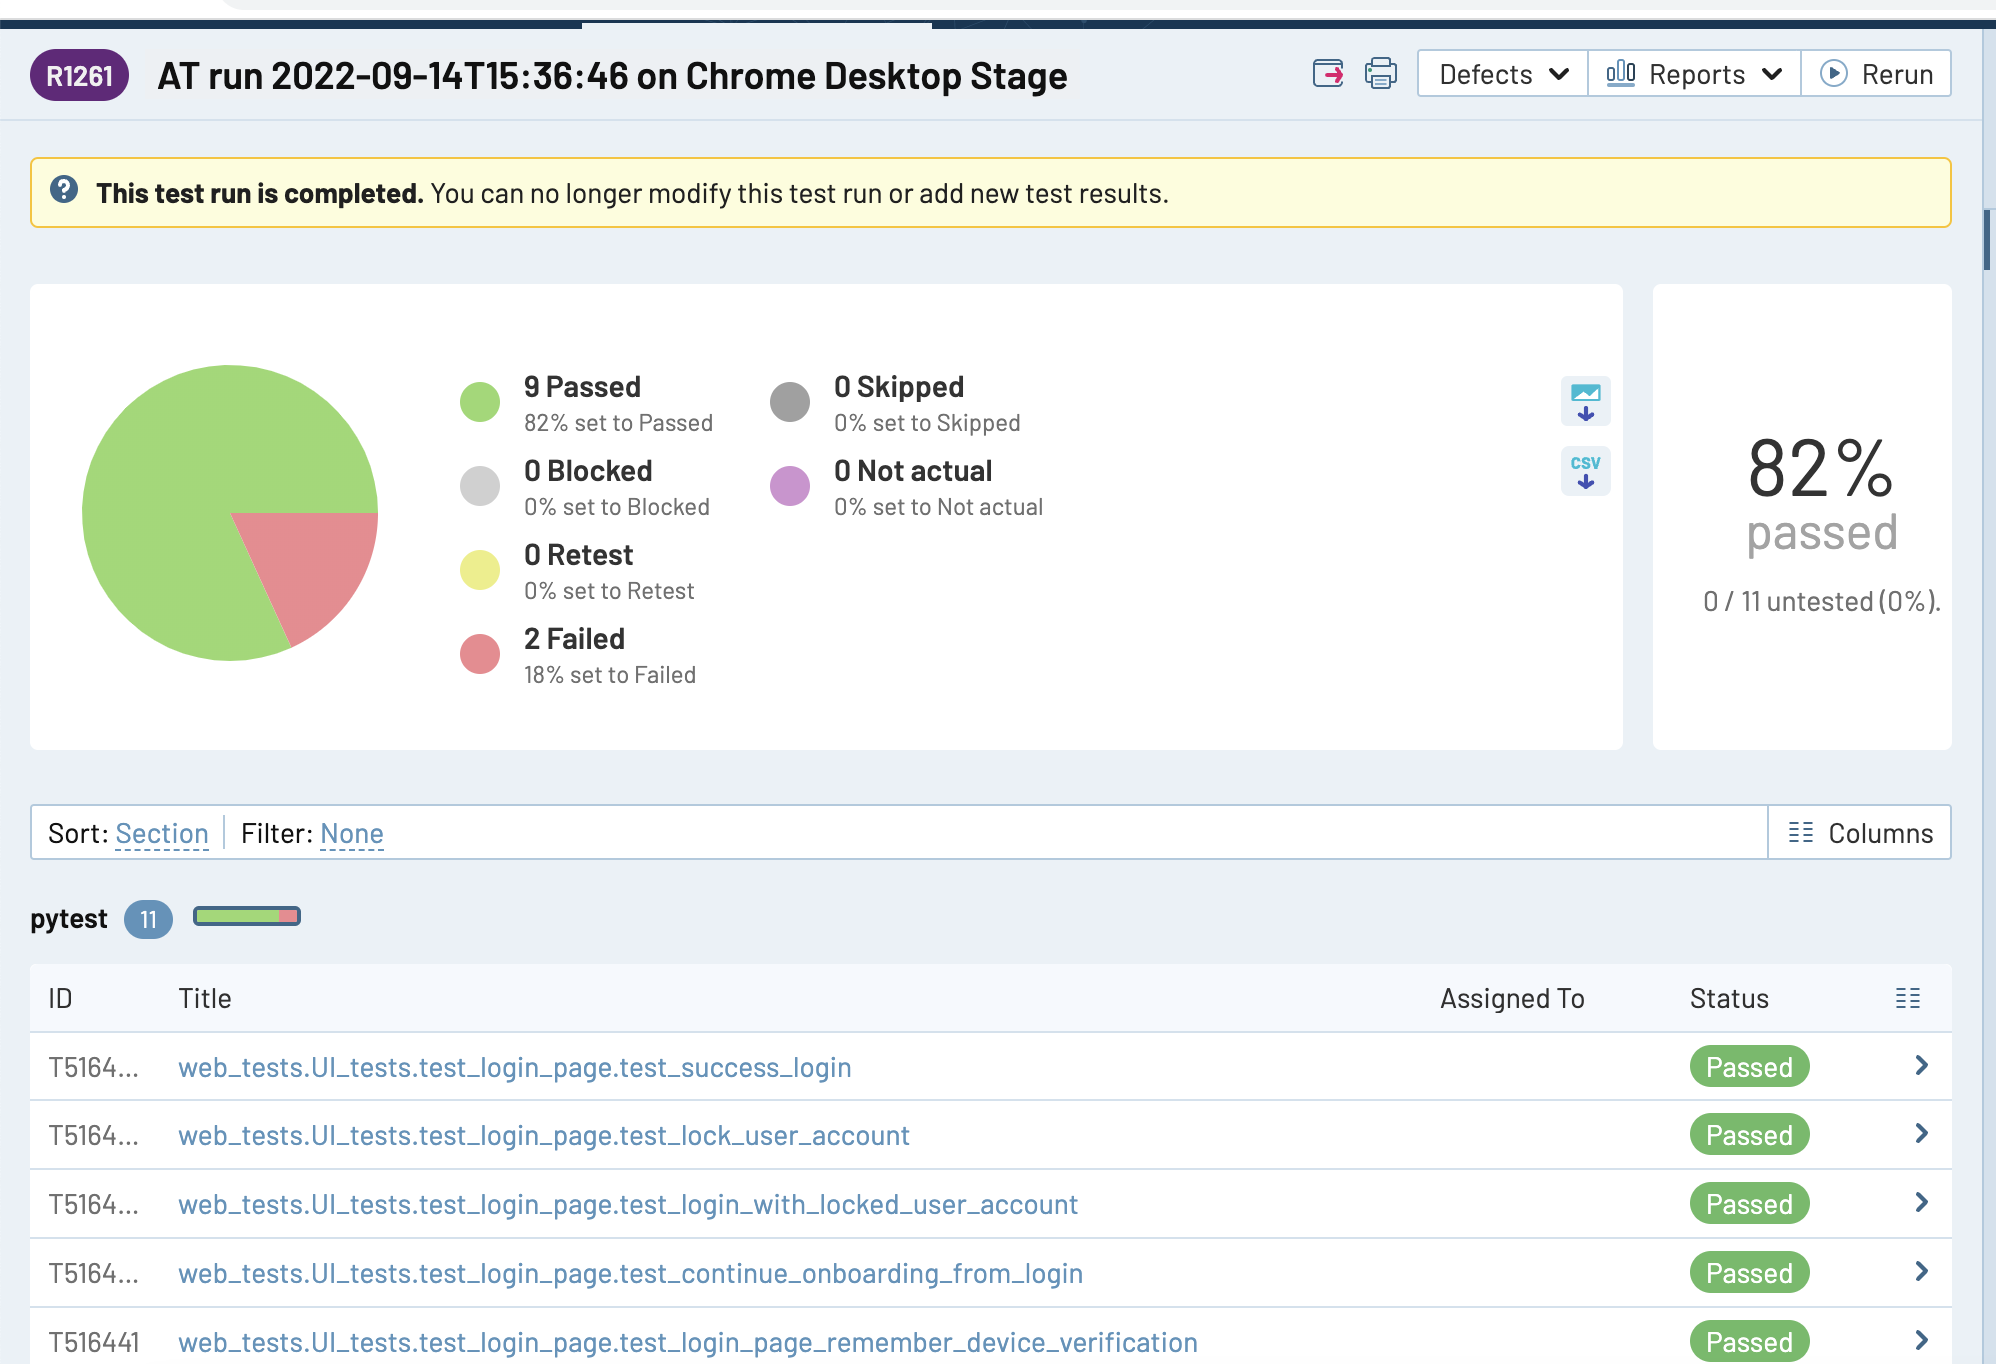
Also, you can set up other params separately without need to re-initialize api object:
set_project_id(project_id) - change project id
def set_suite_id(suite_id) - change suite id
def set_xml_filename(xml_filename) - change path/filename of xml report
set_at_report_section(section_name) - change default folder name where non-linked testcases will be created
set_timestamp(new_timestamp) - change default timestamp to custom
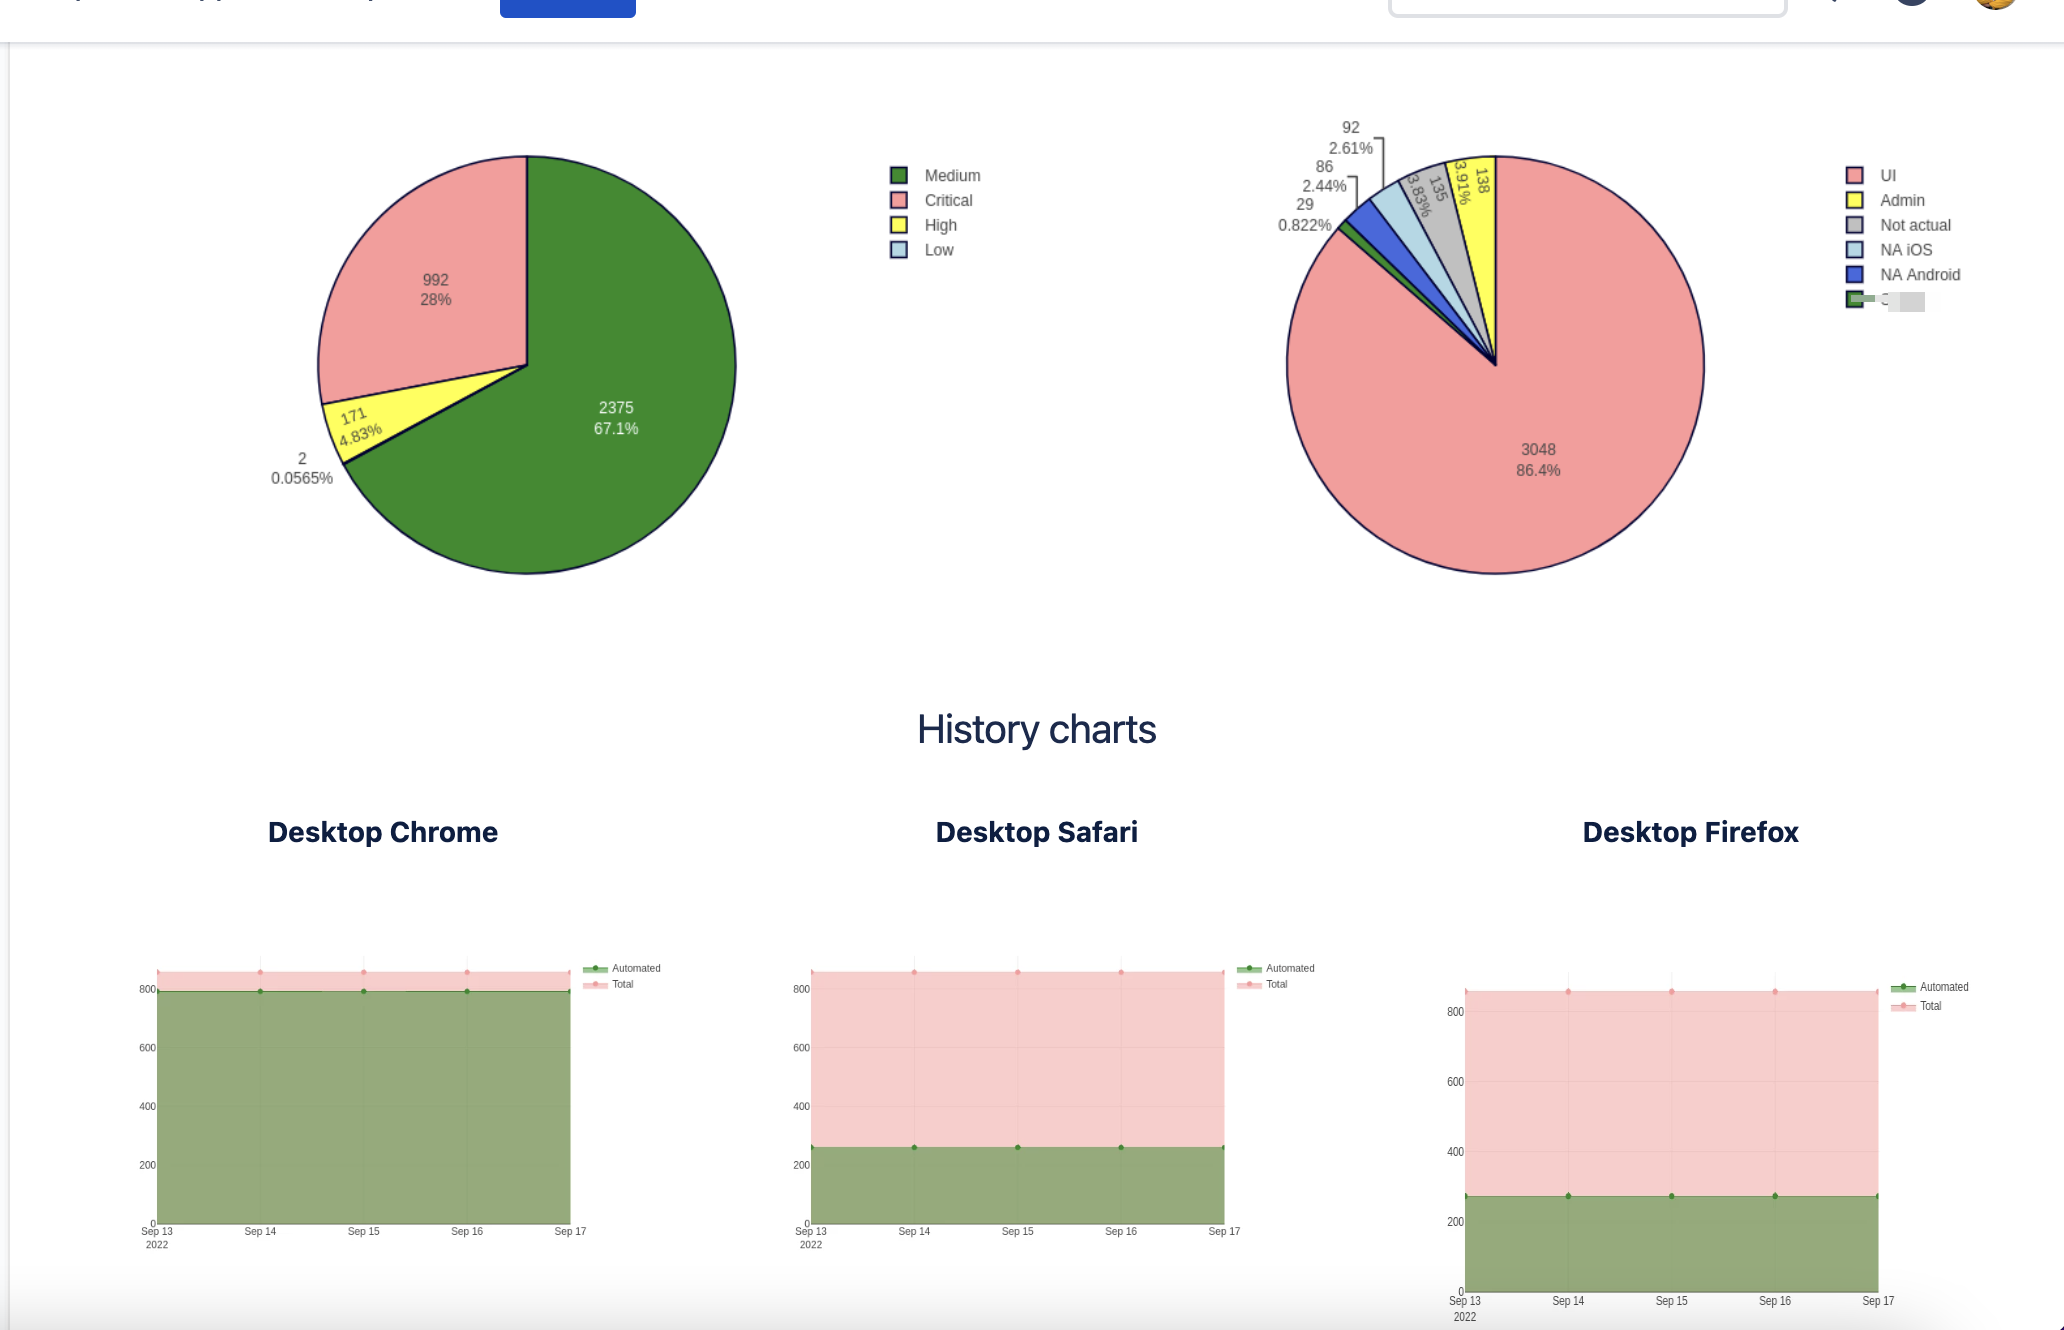
Second part of reporter it's visualization and reporting for test cases of TestRails. Currently, TestRails machine does not contain functionality to track history data of some test cases attributes to make reports of dynamics of automation coverage of existing testcases, or distribution by custom areas. Also, it would be great to pass results as charts and report it to, for example, to Confluence.
So, I have a solution, you can use ConfluenceReporter!
# Create reporter
confluence_reporter = ConfluenceReporter(username='Liberator', password='NoWar', url="https://my.confluence.com", confluence_page="1234")
# Now, generate several report at once!
confluence_reporter.generate_report(reports=automation_distribution, cases=area_distribution, values=priority_distribution, type_platforms=my_platforms,
                        automation_platforms=my_automation_platforms)
# for detailed info refer to code itself, you can use also separate calls:
confluence_reporter.history_type_chart(type_platforms=my_platforms)  # history report of coverage by sections
confluence_reporter.history_state_chart(automation_platforms=my_automation_platforms)  # history report of coverage by some attribute
confluence_reporter.contest_case_area_distribution(cases=area_distribution)  # bar chart of area distribution
confluence_reporter.test_case_priority_distribution(values=priority_distribution)  # bar chart of priority distribution
confluence_reporter.automation_state(reports=automation_distribution)  # stacked bar chart using specific field as input
Ok, most likely, you wonder when you can obtain these distributions? You can do it by using ATCoverageReporter!
testrails_adapter = ATCoverageReporter(url=tr_url, email=tr_client_email, password=tr_client_password,
                                 project=tr_default_project, priority=4, type_platforms=my_platforms,
                                 automation_platforms=automation_platforms)
# now get the values for charts!
values = tr_reporter.test_case_by_priority()
cases = tr_reporter.test_case_by_type()
reports = tr_reporter.automation_state_report()
So, I guess you still confused, what is the "platforms"? It's the settings, where and which data needs to be collected
# You need specify where (at which top section) test cases for specific platform (or test type, whatever) is stored
# Also you need to specify by which field is used as criteria for automation, default 'internal_name' is 'type_id' and
# it is by default "Automated", "Functional", "Other", etc.
automation_platforms = (
    {'name': 'Desktop Chrome', 'internal_name': 'type_id', 'sections': [4242]},
    {'name': 'Desktop Firefox', 'internal_name': 'custom_firefox', 'sections': [2424]})
# Also, when you don't need to obtain automation state for cases, you can simply use just passing of section:
type_platforms = (
    {'name': 'UI', 'sections': [6969]},
    {'name': 'API', 'sections': [9696]})
I hope now it's clear. But what if you do not use Confluence? Ok, well, you can draw charts directly:
plotly_reporter = PlotlyReporter(type_platforms=type_platforms)
plotly_reporter.draw_test_case_by_priority(filename='stacked_bar_chart.png', values=values)
plotly_reporter.draw_test_case_by_area(filename='pie_chart1.png', cases=cases)
plotly_reporter.draw_automation_state_report(filename="pie_chart2.png", reports=reports)
plotly_reporter.draw_history_type_chart(filename="line_stacked_chart.png")
for item in automation_platforms:
    plotly_reporter.draw_history_state_chart(chart_name=item['name'])
If you still want to share reports, you can do it via email using EmailSender:
chart_drawings = ['report_chart.png', 'path/to/more_graphics.png']
chart_captions = ['Priority distribution', 'AT coverage']
emailer = EmailSender(email="my_personal@email.com",
                      password="my_secure_password",
                      server_smtp="smtp.email_server.com",
                      server_port=587)
emailer.send_message(files=chart_drawings, captions=chart_captions, recipients=['buddy@email.com', 'boss@email.com'])
Alternatively, you can use GMail API with OAuth token instead of less secure auth:
emailer = EmailSender(email="my_personal@gmail.com",
                      gmail_token="token.json")
For setup GMail OAuth credentials see the Google API Reference.
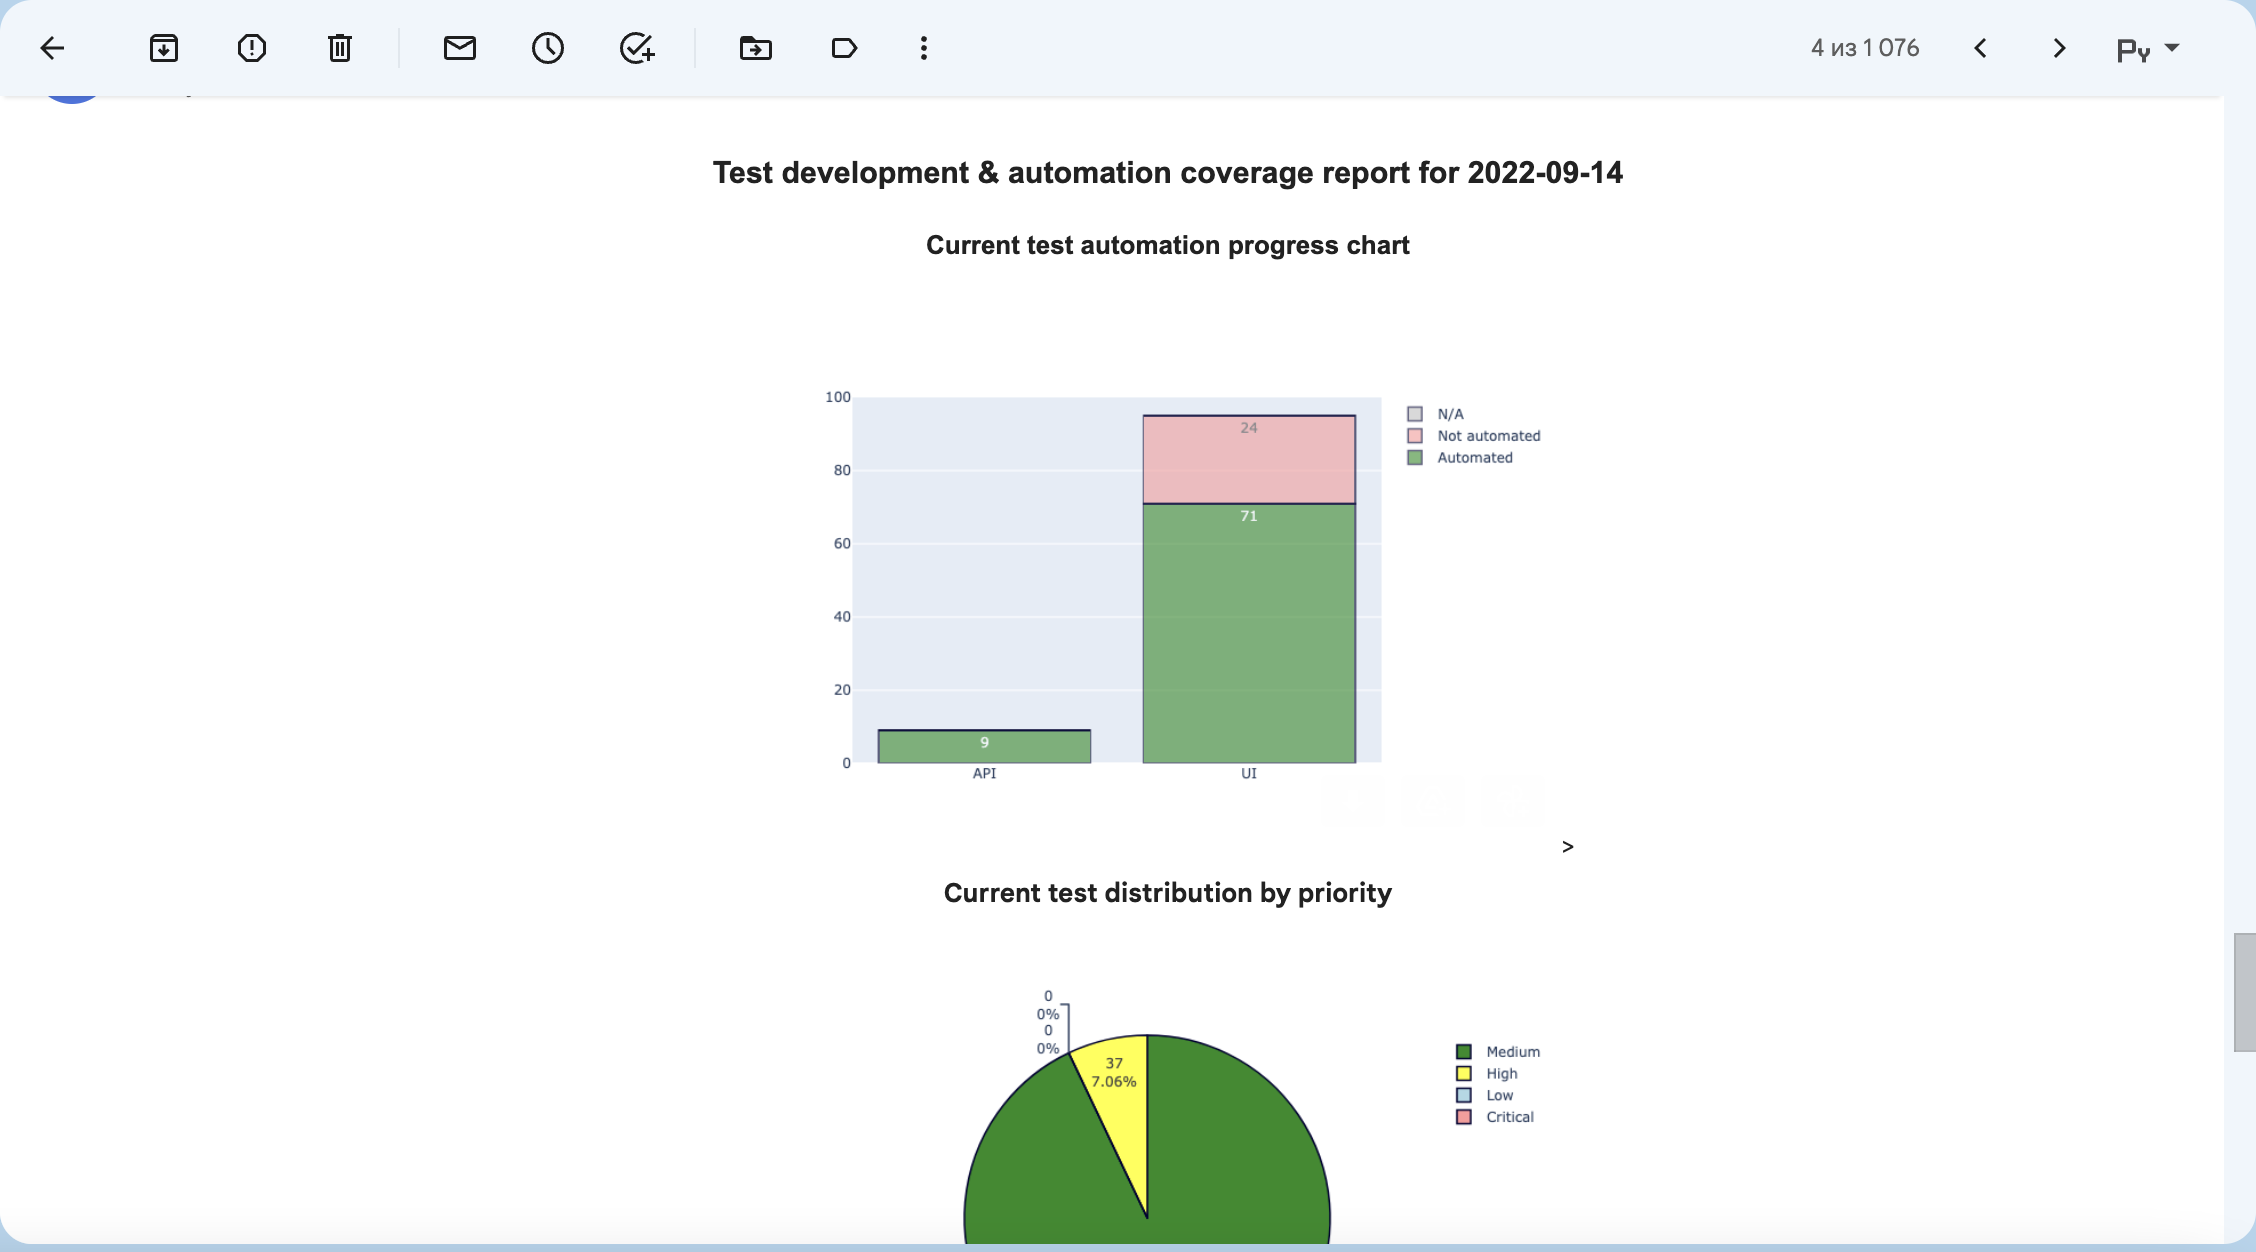
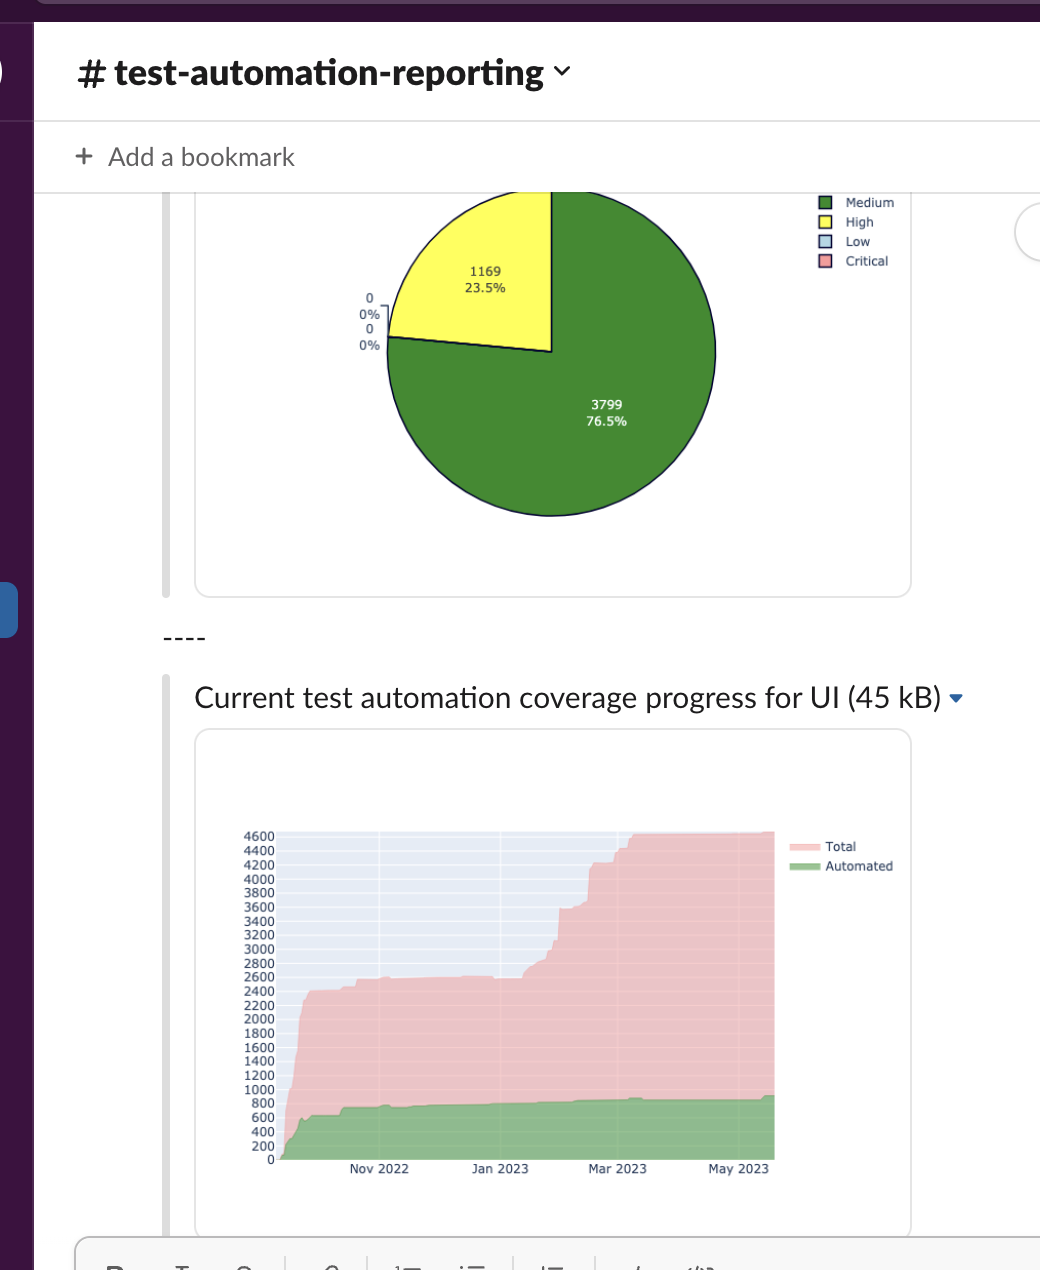
Or you can send as Slack message using SlackSender
slack_sender = SlackSender(hook_url='https://hooks.slack.com/services/{your}/{api}/{key}')
slack_sender.send_message(files=chart_drawings, captions=chart_captions)
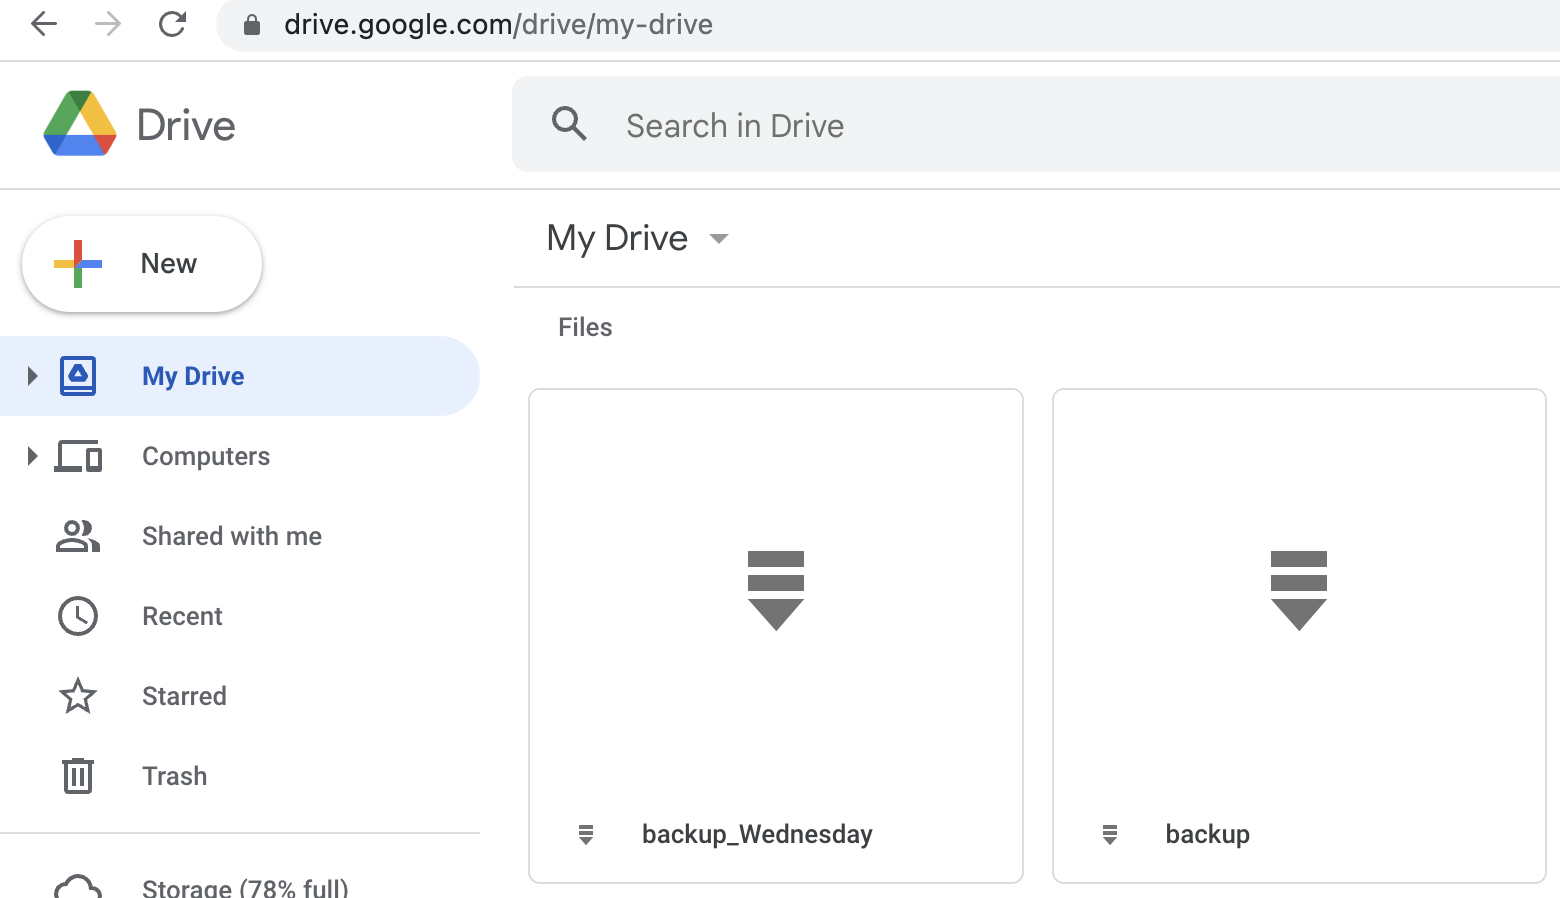
Sometimes you need backup you progress. Minimum what you can do - it's backup test cases. So, you can do it using TCBackup
tc_backup = TCBackup(tr_url, tr_email, tr_password, test_rails_suite=3)
tc_backup.backup()  # this will produce backup.xml file
tc_backup.get_archive_backup(suffix='')  # this will produce backup.zip file
You still need to save it? Let's use Google Drive and GoogleDriveUploader
# Google token needs to be configured firstly, to do it, you have to visit:
# https://console.developers.google.com/apis/credentials?pli=1
# Create Credentials => OAuth client ID => TV and limited Input Devices and get client_id and a client_secret
# Then pass it as google_id = client_id and google_secret = client_secret
gdrive = GoogleDriveUploader(google_id=client_id, google_secret=client_secret)
# first run prompts you to enter user_code to your user account and activate API token,
# but if you already have access tokens, do following:
gdrive = GoogleDriveUploader(google_id=client_id, google_secret=client_secret, google_api_refresh_token=refresh_token)
# now you may upload any file, but by default I assume you will use backup.zip
gdrive.upload(filename='backup.zip', mime_type='application/zip')
To make plotly works, you need to set up Orca independently:
npm install -g electron orca
Please note, that Slack expecting urls instead of filenames, so, you must upload images to some hosting. As option, you can do it using https://freeimage.host via function:
image_uploaded = upload_image(filename=chart_drawings[0], api_token=YOUR_SECRET_TOKEN)
# now you can extract URL
image_url = image_uploaded['image']
# or its thumbnail
image_thumb = image_uploaded['thumb']
If you like this project, you can support it by donating via DonationAlerts.
FAQs
TestRail API reporter tools
We found that testrail-api-reporter demonstrated a healthy version release cadence and project activity because the last version was released less than a year ago. It has 1 open source maintainer collaborating on the project.
Did you know?

Socket for GitHub automatically highlights issues in each pull request and monitors the health of all your open source dependencies. Discover the contents of your packages and block harmful activity before you install or update your dependencies.

Product
Automatically fix and test dependency updates with socket fix—a new CLI tool that turns CVE alerts into safe, automated upgrades.

Security News
CISA denies CVE funding issues amid backlash over a new CVE foundation formed by board members, raising concerns about transparency and program governance.
Product
We’re excited to announce a powerful new capability in Socket: historical data and enhanced analytics.