
Security News
Crates.io Users Targeted by Phishing Emails
The Rust Security Response WG is warning of phishing emails from rustfoundation.dev targeting crates.io users.
By Sarah Gooding - Sep 12, 2025
treemind is a high-performance library for interpreting tree-based models. It supports regression, binary and multiclass classification, and handles both numerical and categorical features. By analyzing split intervals and feature interactions, treemind helps you understand which features drive predictions and how they interact making it ideal for model explanation, debugging, and auditing.
A formal research paper detailing the theoretical foundation of
treemindis forthcoming.
Install treemind via pip:
pip install treemind
Feature Analysis Quantifies how individual features influence predictions across specific decision boundaries.
Interaction Detection
Detects and visualizes interaction effects between two or more features at any order n, constrained by memory and time.
Optimized Performance Fast even on deep models thanks to efficient Cython-backed core.
Rich Visualizations Interactive and static plots to visualize importance, split intervals, and interaction strength.
Broad Model Support
Compatible with xgboost, lightgbm, catboost, sklearn, and perpetual. Works with regression, binary, and multiclass tasks. Supports categorical features.
The treemind algorithm analyzes how often features and their combinations appear in decision paths, then summarizes their behavior over split intervals.
This walkthrough shows how to use treemind.Explainer with a LightGBM model trained on the Breast Cancer dataset.
from lightgbm import LGBMClassifier
from sklearn.datasets import load_breast_cancer

from treemind import Explainer
from treemind.plot import (
    feature_plot,
    interaction_plot,
    interaction_scatter_plot,
    importance_plot,
)

# Load sample data
X, y = load_breast_cancer(return_X_y=True, as_frame=True)

# Train a model
model = LGBMClassifier(verbose=-1)
model.fit(X, y)

# Create an explainer
explainer = Explainer(model)
To see how often each feature (or feature pair) appears in the decision trees:
explainer.count_node(degree=1) # Individual feature usage
| column_index | count |
|--------------|-------|
| 21           | 1739  |
| 27           | 1469  |
explainer.count_node(degree=2) # Pairwise feature usage
| column1_index | column2_index | count |
|---------------|---------------|-------|
| 21            | 22            | 927   |
| 21            | 23            | 876   |
Analyze how a single feature influences the model:
result1_d = explainer.explain(degree=1)
Inspect a specific feature (e.g., feature 21):
result1_d[21]
| worst_texture_lb | worst_texture_ub | value     | std      | count  |
|------------------|------------------|-----------|----------|--------|
| -inf             | 18.460           | 3.185128  | 8.479232 | 402.24 |
| 18.460           | 19.300           | 3.160656  | 8.519873 | 402.39 |
feature_plot(result1_d, 21)

result1_d.importance()
| feature_0            | importance |
|----------------------|------------|
| worst_concave_points | 2.326004   |
| worst_perimeter      | 2.245493   |
importance_plot(result1_d)

Evaluate how two features interact to influence predictions:
result2_d = explainer.explain(degree=2)
result2_d[21, 22]
| worst_texture_lb | worst_texture_ub | worst_concave_points_lb | worst_concave_points_ub | value    | std      | count  |
|------------------|------------------|--------------------------|--------------------------|----------|----------|--------|
| -inf             | 18.46            | -inf                     | 0.058860                 | 4.929324 | 7.679424 | 355.40 |
result2_d.importance()
| feature_0         | feature_1            | importance |
|------------------|----------------------|------------|
| worst_perimeter  | worst_area           | 2.728454   |
| worst_texture    | worst_concave_points | 2.439605   |
importance_plot(result2_d)

interaction_plot(result2_d, (21, 22))

interaction_scatter_plot(X, result2_d, (21, 22))

Contributions are welcome! If you'd like to improve treemind or suggest new features, feel free to fork the repository and submit a pull request.
treemind is released under the MIT License. See the LICENSE file for details.
FAQs
feature and feature interaction analyzer for gradient boosting
We found that treemind demonstrated a healthy version release cadence and project activity because the last version was released less than a year ago. It has 1 open source maintainer collaborating on the project.
Did you know?

Socket for GitHub automatically highlights issues in each pull request and monitors the health of all your open source dependencies. Discover the contents of your packages and block harmful activity before you install or update your dependencies.
Security News
The Rust Security Response WG is warning of phishing emails from rustfoundation.dev targeting crates.io users.
Product
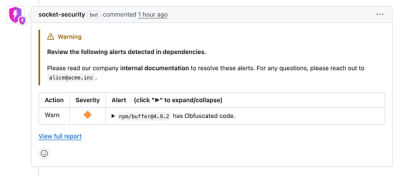
Socket now lets you customize pull request alert headers, helping security teams share clear guidance right in PRs to speed reviews and reduce back-and-forth.

Product
Socket's Rust support is moving to Beta: all users can scan Cargo projects and generate SBOMs, including Cargo.toml-only crates, with Rust-aware supply chain checks.