Security News
/Product
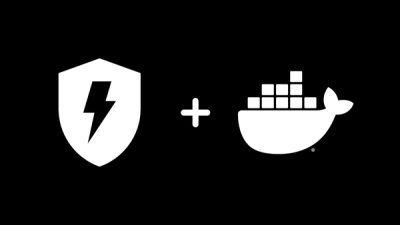
Socket Firewall Now Available in Docker Hardened Images
Socket Firewall Free is now bundled into Docker Hardened Images, adding build-time and dependency-install supply chain protection on top of hardened base images for Node.js, Python, and Rust.
By Sarah Gooding - Dec 17, 2025