Use it to build beautiful and powerful data visualization apps quickly and easily, without needing advanced engineering or visual design expertise.
Then customize and deploy your app to production at scale.
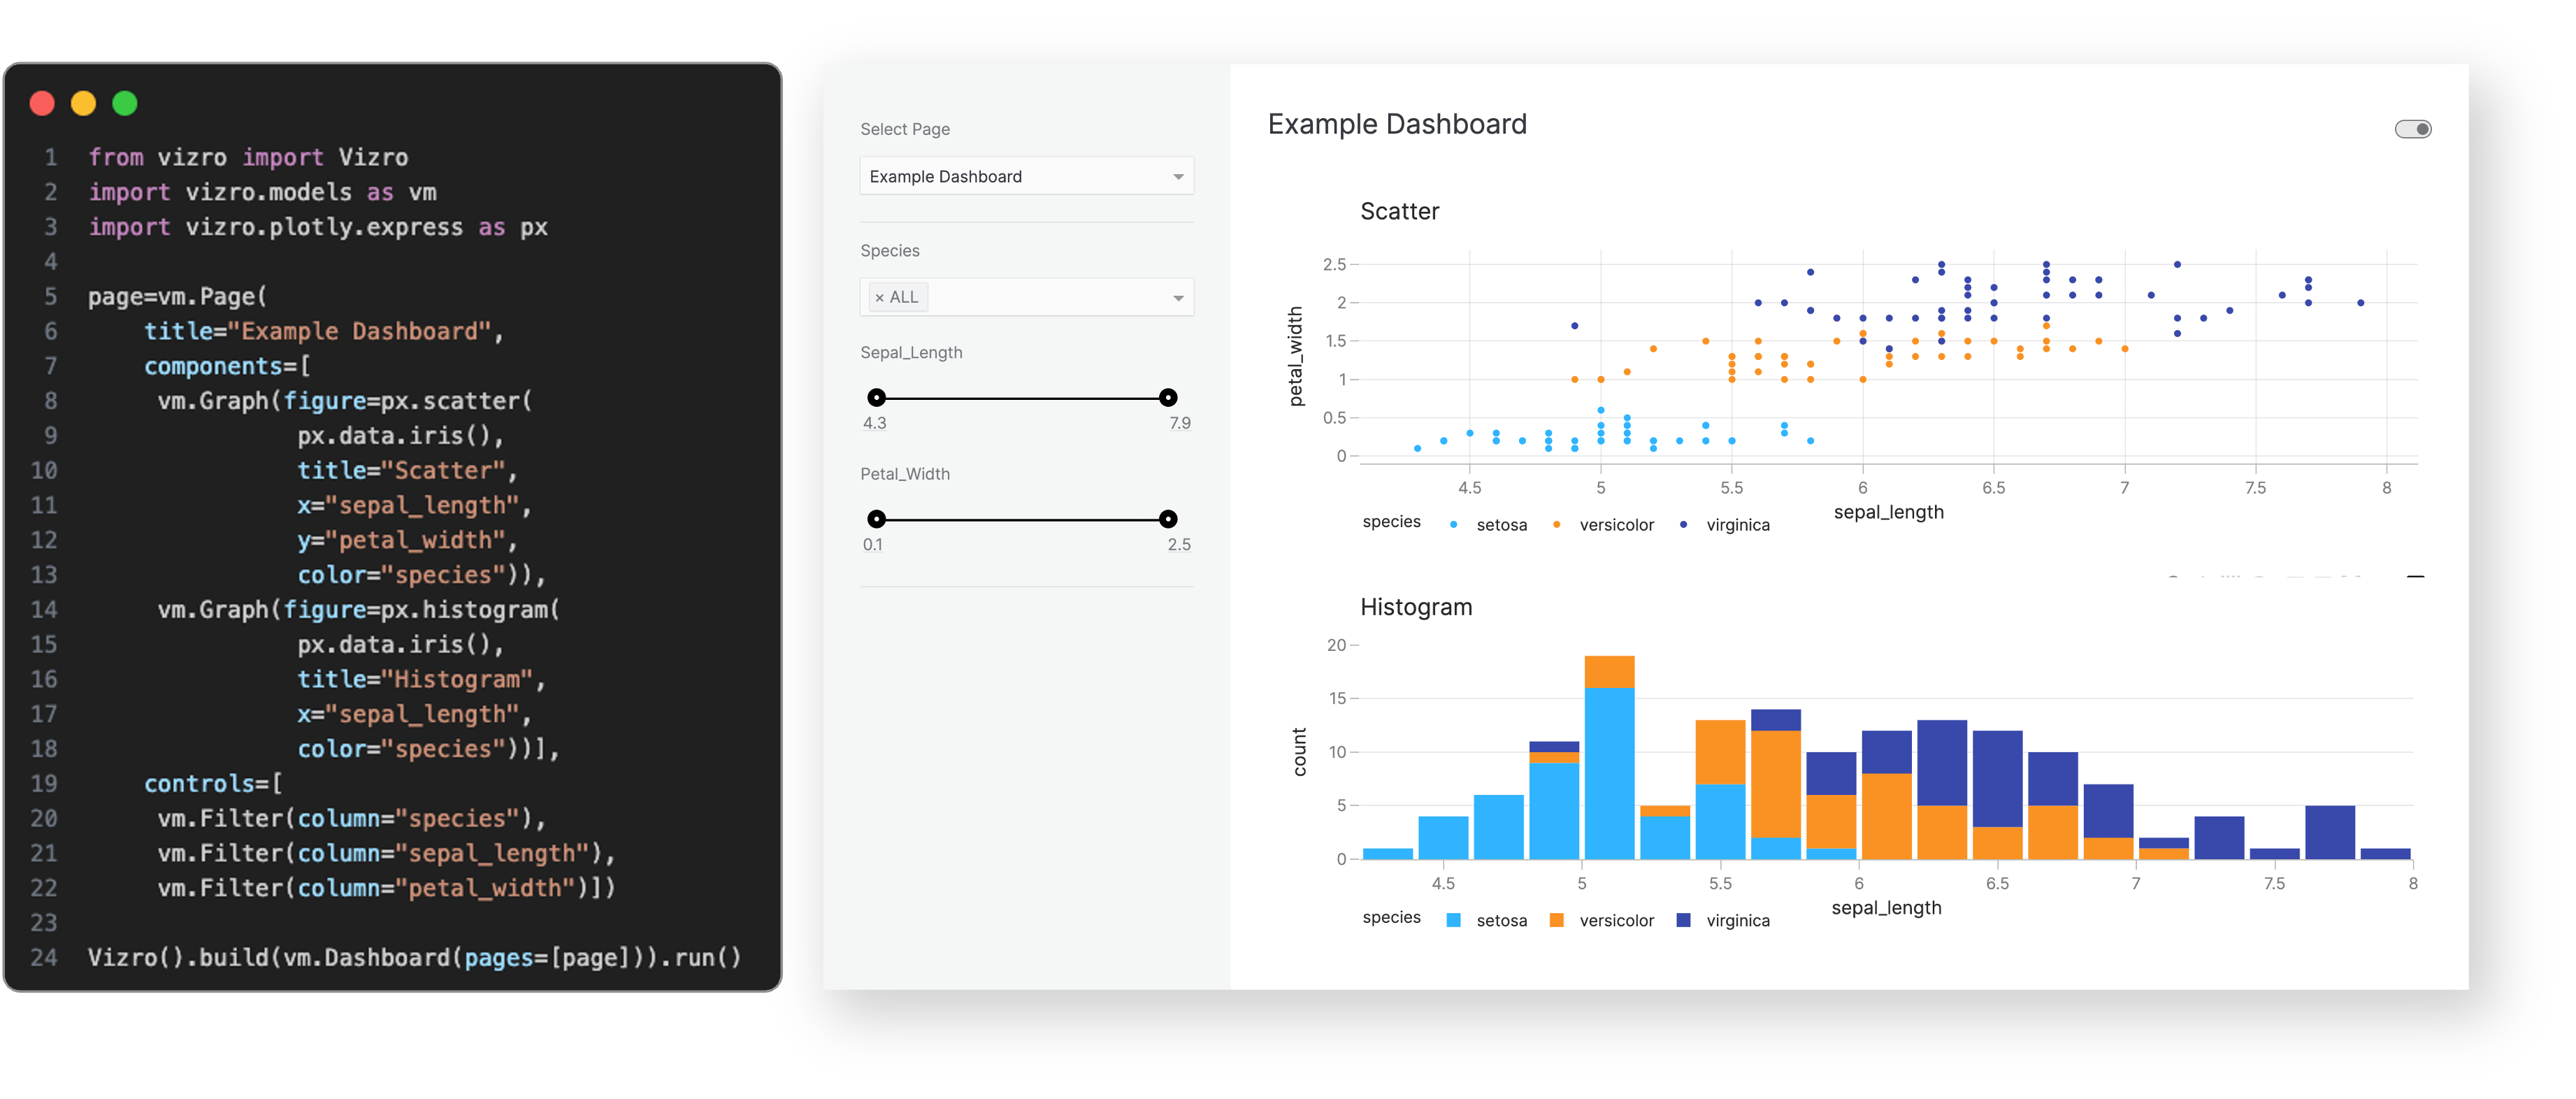
In just a few lines of simple low-code configuration, with in-built visual design best practices, you can quickly assemble high-quality, multi-page prototypes, that are production-ready.
Every Vizro app is defined by a simple configuration, using these high-level categories:
Components: charts, tables, cards, KPI indicators, forms and more.
Controls: filters and parameters, using a range of selectors such as drop-down menus and sliders.
Actions: interactions between components, drill-throughs, export functionality and more.
Layouts: grid layouts or flexible containers, with a range of pre-set styles.
Navigation: a range of app layout and navigation settings, including nested page hierarchies.
Configuration can be written in multiple formats including Pydantic models, JSON, YAML or Python dictionaries for added flexibility of implementation.
Optional high-code extensions enable almost infinite customization in a modular way, combining the best of low-code and high-code - including bespoke visual formatting and custom components.
Visit the "How-to guides" for a more detailed explanation of Vizro features.
Why use Vizro?
The benefits of the Vizro toolkit include:
Vizro helps you to build data visualization apps that are:
Quick and easy
Build apps in minutes. Use a few lines of simple configuration (via Pydantic models, JSON, YAML, or Python dictionaries) in place of thousands of lines of code.
Beautiful and powerful
Build high-quality multi-page apps without needing advanced engineering or visual design expertise. Use powerful features of production-grade BI tools, with in-built visual design best practices.
Flexible
Benefit from the capabilities and flexibility of open-source packages. Use the trusted dependencies of Plotly, Dash, and Pydantic.
Customizable
Almost infinite control for advanced users. Use Python, JavaScript, HTML and CSS code extensions.
Scalable
Rapidly prototype and deploy to production. Use the in-built production-grade capabilities of Plotly, Dash and Pydantic.
Use Vizro when you need to combine the speed and ease of low-code Python tools, with production capabilities of JavaScript and BI tools, and the freedom of open source:
Have an app that looks beautiful and professional by default.
Enjoy the simplicity of low-code, plus the option to customize with code almost infinitely.
Rapidly create prototypes which are production-ready and easy to deploy at scale.
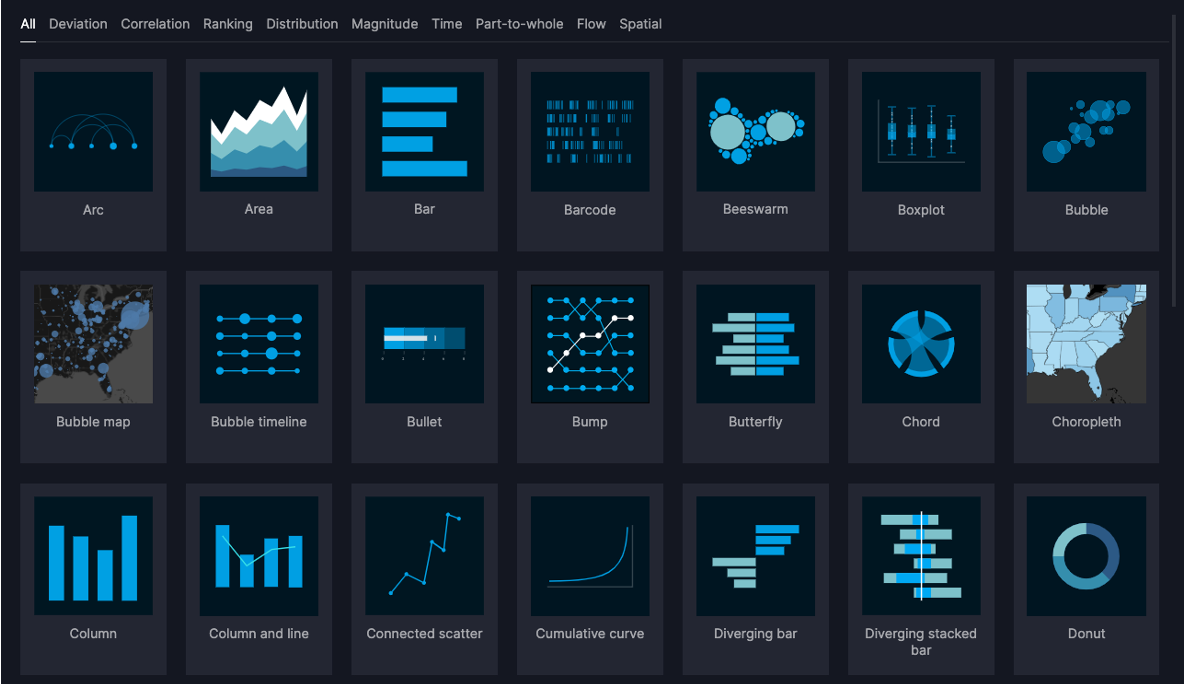
The visual vocabulary helps you to decide which chart type to use for your requirements, and offers sample code to create these charts with Plotly or embed them into a Vizro dashboard.
Visit the visual vocabulary to search for charts or get inspiration.
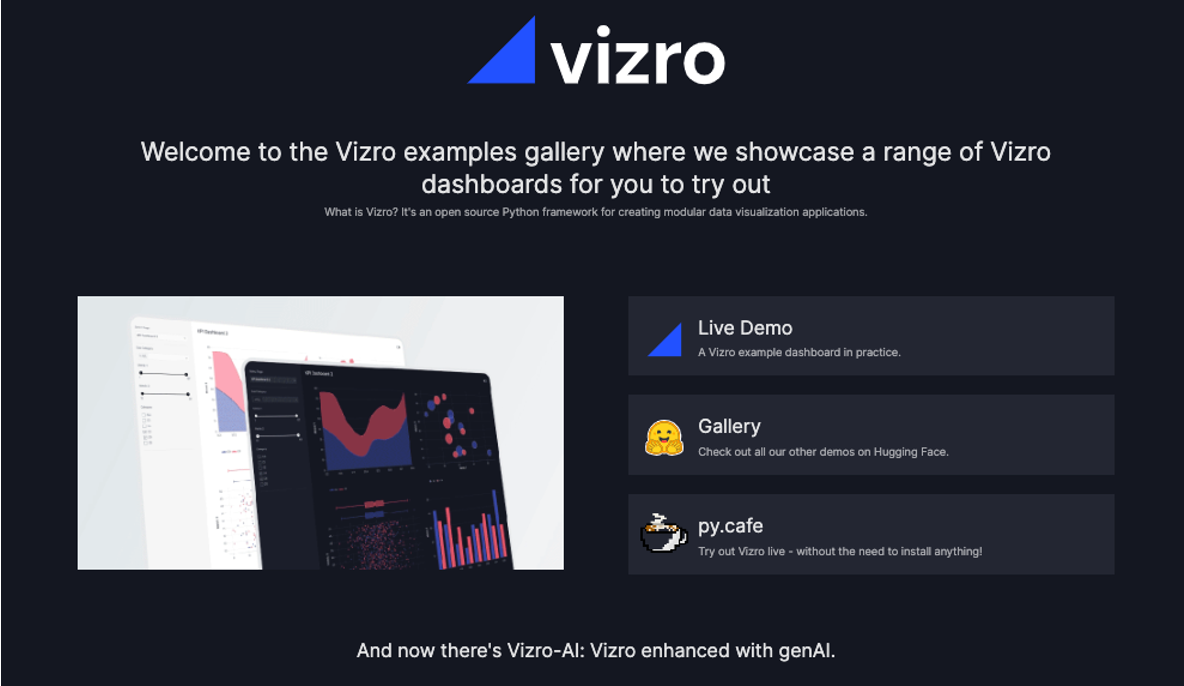
The dashboard examples gallery enables you to explore Vizro in action by viewing interactive example apps. You can copy the code to use as a template or starter for your next dashboard.
Vizro-MCP works alongside an LLM to help you create Vizro dashboards and charts. It provides tools and templates to create a functioning Vizro chart or dashboard step-by-step.
Compatible with MCP-enabled LLM clients such as Cursor or Claude Desktop.
Vizro-AI dashboard generation is no longer actively developed and is superseded by Vizro-MCP. Vizro-AI supports only chart generation from version 0.4.0.
Vizro-AI is a separate package (called vizro_ai) that extends Vizro to incorporate LLMs. Use it to build interactive Vizro charts and dashboards, by simply describing what you need in plain English or other languages.
We encourage you to ask and discuss any technical questions via the GitHub Issues. This is also the place where you can submit bug reports or request new features.
Vizro is a low-code framework for building high-quality data visualization apps.
We found that vizro demonstrated a healthy version release cadence and project activity because the last version was released less than a year ago.It has 4 open source maintainers collaborating on the project.
Did you know?
Socket for GitHub automatically highlights issues in each pull request and monitors the health of all your open source dependencies. Discover the contents of your packages and block harmful activity before you install or update your dependencies.
Socket CEO Feross Aboukhadijeh and a16z partner Joel de la Garza discuss vibe coding, AI-driven software development, and how the rise of LLMs, despite their risks, still points toward a more secure and innovative future.