Web-PDB
#######
.. image:: https://github.com/romanvm/python-web-pdb/actions/workflows/tests.yml/badge.svg
:target: https://github.com/romanvm/python-web-pdb/actions/workflows/tests.yml
:alt: GitHub Action tests
.. image:: https://badge.fury.io/py/web-pdb.svg
:target: https://badge.fury.io/py/web-pdb
:alt: PyPI version
Web-PDB is a web-interface for Python's built-in PDB_ debugger.
It allows to debug Python scripts remotely in a web-browser.
Important Notice
Currently this project is in a minimum maintenance mode.
It means that I will try to maintain compatibility with new Python versions and address
critical issues, if any arise. But at the moment I have no time or resources to develop
new features or properly review external contributions. That is why only pull requests
with bug fixes will be prioritized. Other issues or pull requests may or may not be reviewed or accepted.
Features
- Responsive design based on
Bootstrap_.
- Python syntax highlighting with
Prism_ ("Okaida" theme).
- Supports all PDB features.
- Standard input and output can be redirected to the web-console
to interact with Python scripts remotely.
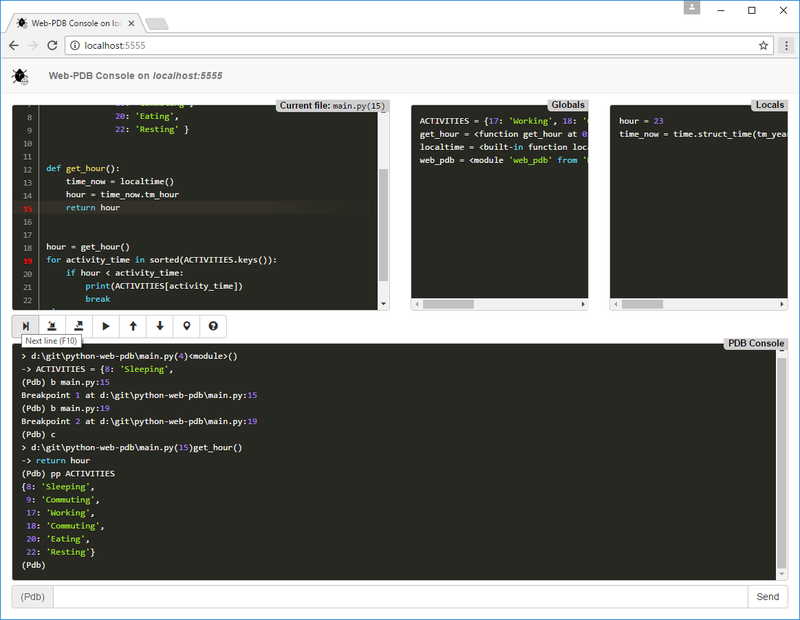
- Current file box tracks current position in a file being executed.
Red line numbers indicate breakpoints, if any.
- Globals and Locals boxes show local and global variables in the current scope.
Special variables that start and end with double underscores
__ are excluded
(you can always view them using PDB commands).
- Command history that stores up to 10 last unique PDB commands (accessed by arrow UP/DOWN keys).
.. figure:: https://raw.githubusercontent.com/romanvm/python-web-pdb/master/screenshot.png
:alt: Web-PDB screenshot
:width: 640px
:height: 490px
Web-PDB console in Chrome browser
Usage
Install Web-PDB into your working Python environment::
pip install web-pdb
Insert the following line into your Python program at the point where you want
to start debugging:
.. code-block:: python
import web_pdb; web_pdb.set_trace()
The set_trace() call will suspend your program and open a web-UI at the default port 5555
(port value can be changed). Enter in your browser's address bar:
http://<your Python machine hostname or IP>:5555,
for example http://monty-python:5555,
and you should see the web-UI like the one on the preceding screenshot.
Now you can use all PDB commands and features. Additional Current file, Globals
and Locals information boxes help you better track your program runtime state.
Note: it is strongly recommended to work with the Web-PDB web-UI only in one browser session.
With more than one browser window accessing the web-UI it may display incorrect data in one or more
browser sessions.
Subsequent set_trace() calls can be used as hardcoded breakpoints.
Web-PDB is compatible with the new breakpoint()_ function added in Python 3.7.
Set environment variable PYTHONBREAKPOINT="web_pdb.set_trace" to launch Web-PDB
with breakpoint().
Additionally, Web-PDB provides catch_post_mortem context manager that can catch
unhandled exceptions raised within its scope and automatically start PDB post-mortem debugging session.
For example:
.. code-block:: python
import web_pdb
with web_pdb.catch_post_mortem():
# Some error-prone code
assert foo == bar, 'Oops!'
For more detailed info about the Web-PDB API read docstrings in the ./web_pdb/__init__.py file.
The inspect Command
Web-PDB provides inspect or i command that is not present in the original PDB.
This command outputs the list of object's members along with their values.
Syntax: inspect <object_name> or i <object_name>.
Special members with names enclosed in double underscores (__) are ignored.
Considerations for Multithreading and Multiprocessing Programs
Multithreading
Web-PDB maintains one debugger instance that traces only one thread. You should not call set_trace()
from different threads to avoid race conditions. Each thread needs to be debugged separately one at a time.
Multiprocessing
Each process can have its own debugger instance provided you call set_trace with a different port value
for each process. This way you can debug each process in a separate browser tab/window.
To simplify this you can use set_trace(port=-1) to select a random port between 32768 and 65536.
Compatibility
- Python: 3.6+
- Browsers: Firefox, Chrome (all modern browsers should work)
License
MIT, see LICENSE.txt.
The debugger icon made by Freepik_ from www.flaticon.com_ is licensed by CC 3.0 BY_.
.. _PDB: https://docs.python.org/3.6/library/pdb.html
.. _Bootstrap: http://getbootstrap.com
.. _Prism: http://prismjs.com/
.. _Freepik: http://www.freepik.com
.. _www.flaticon.com: http://www.flaticon.com
.. _CC 3.0 BY: http://creativecommons.org/licenses/by/3.0/
.. _breakpoint(): https://docs.python.org/3/library/functions.html#breakpoint


