Security News
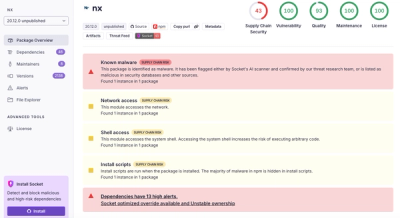
Nx npm Packages Compromised in Supply Chain Attack Weaponizing AI CLI Tools
Malicious Nx npm versions stole secrets and wallet info using AI CLI tools; Socket’s AI scanner detected the supply chain attack and flagged the malware.
Wrappers of ECharts Javascript Chart Libary for Rails 3.1+
Check out how to use ECharts at http://echarts.baidu.com
Add this line to your application's Gemfile:
gem 'echarts-rails'
And then execute:
$ bundle
Or install it yourself as:
$ gem install echarts-rails
Now you need to edit your app/assets/javascripts/application.js file and add echarts , echarts-simple or echarts-common into it:
//= require echarts
The difference between echarts , echarts.simple or echarts.common :
echarts-en: Includes all charts and components.
echarts.simple-en: Only includes basic charts: line bar pie.
echarts.common-en: Includes common charts and components: line bar pie scatter legend tooltip toolbox markLine markPoint markArea dataZoom
echarts: 包含所有图表组件。
echarts.simple: 只包含基础图表: 折 柱 饼。
echarts.common: 包含常用的图表组件:折 柱 饼 散点 图例 工具栏 标注 标线 数据区域缩放
And you're done!
<!-- prepare a DOM container with width and height -->
<div id="main" style="width: 600px;height:400px;"></div>
<script type="text/javascript">
    // based on prepared DOM, initialize echarts instance
    var myChart = echarts.init(document.getElementById('main'));

    // specify chart configuration item and data
    var option = {
        title: {
            text: 'ECharts entry example'
        },
        tooltip: {},
        legend: {
            data:['Sales']
        },
        xAxis: {
            data: ["shirt","cardign","chiffon shirt","pants","heels","socks"]
        },
        yAxis: {},
        series: [{
            name: 'Sales',
            type: 'bar',
            data: [5, 20, 36, 10, 10, 20]
        }]
    };

    // use configuration item and data specified to show chart
    myChart.setOption(option);
</script>
You can also go to ECharts Gallery to view examples.
The gem is available as open source under the BSD license.
ECharts is available under the BSD license.
FAQs
Unknown package
We found that echarts-rails demonstrated a not healthy version release cadence and project activity because the last version was released a year ago. It has 1 open source maintainer collaborating on the project.
Did you know?

Socket for GitHub automatically highlights issues in each pull request and monitors the health of all your open source dependencies. Discover the contents of your packages and block harmful activity before you install or update your dependencies.

Security News
Malicious Nx npm versions stole secrets and wallet info using AI CLI tools; Socket’s AI scanner detected the supply chain attack and flagged the malware.

Security News
CISA’s 2025 draft SBOM guidance adds new fields like hashes, licenses, and tool metadata to make software inventories more actionable.

Security News
A clarification on our recent research investigating 60 malicious Ruby gems.