
Security News
MCP Steering Committee Launches Official MCP Registry in Preview
The MCP Steering Committee has launched the official MCP Registry in preview, a central hub for discovering and publishing MCP servers.
By Sarah Gooding - Sep 09, 2025
emerose-perftools.rb
Advanced tools
google-perftools for ruby code (c) 2009 Aman Gupta (tmm1)
=== Usage
Run the profiler with a block:
require 'perftools'
PerfTools::CpuProfiler.start("/tmp/add_numbers_profile") do
5_000_000.times{ 1+2+3+4+5 }
end
Start and stop the profiler manually:
require 'perftools'
PerfTools::CpuProfiler.start("/tmp/add_numbers_profile")
5_000_000.times{ 1+2+3+4+5 }
PerfTools::CpuProfiler.stop
Profile an existing ruby application without modifying it:
$ CPUPROFILE=/tmp/my_app_profile RUBYOPT="-r`gem which perftools | tail -1`" ruby my_app.rb
=== Reporting
pprof.rb --text /tmp/add_numbers_profile
pprof.rb --pdf /tmp/add_numbers_profile > /tmp/add_numbers_profile.pdf
pprof.rb --gif /tmp/add_numbers_profile > /tmp/add_numbers_profile.gif
pprof.rb --callgrind /tmp/add_numbers_profile > /tmp/add_numbers_profile.grind kcachegrind /tmp/add_numbers_profile.grind
pprof.rb --gif --focus=Integer /tmp/add_numbers_profile > /tmp/add_numbers_custom.gif
pprof.rb --text --ignore=Gem /tmp/my_app_profile
For more options, see http://google-perftools.googlecode.com/svn/trunk/doc/cpuprofile.html#pprof
=== Examples
pprof.rb --text
Total: 1735 samples
    1487  85.7%  85.7%     1735 100.0% Integer#times
     248  14.3% 100.0%      248  14.3% Fixnum#+
pprof.rb --gif
Simple require 'rubygems' profile

  http://perftools-rb.rubyforge.org/examples/rubygems.gif

Comparing redis-rb with and without SystemTimer based socket timeouts

  http://perftools-rb.rubyforge.org/examples/redis-rb.gif
  http://perftools-rb.rubyforge.org/examples/redis-rb-notimeout.gif

Sinatra vs. Merb vs. Rails

  http://perftools-rb.rubyforge.org/examples/sinatra.gif
  http://perftools-rb.rubyforge.org/examples/merb.gif
  http://perftools-rb.rubyforge.org/examples/rails.gif

C-level profile of EventMachine + epoll + Ruby threads
  before http://timetobleed.com/6-line-eventmachine-bugfix-2x-faster-gc-1300-requestssec/

  http://perftools-rb.rubyforge.org/examples/eventmachine-epoll+nothreads.gif
  http://perftools-rb.rubyforge.org/examples/eventmachine-epoll+threads.gif

C-level profile of the ruby interpreter
  12% time spent in re_match_exec because of excessive calls to rb_str_sub_bang by Date.parse
  easily fixed by using the ThirdBase gem

  http://perftools-rb.rubyforge.org/examples/ruby_interpreter.gif
=== Installation
Just install the gem, which will download, patch and compile google-perftools for you:
sudo gem install perftools.rb
Or use the dev gem from github:
gem install -s http://gems.github.com tmm1-perftools.rb
Or build your own gem:
git clone git://github.com/tmm1/perftools.rb
cd perftools.rb
gem build perftools.rb.gemspec
gem install perftools.rb
You'll also need graphviz to generate call graphs using dot:
sudo port install graphviz     # osx
sudo apt-get install graphviz  # debian/ubuntu
=== Advantages over ruby-prof
Sampling profiler
perftools samples your process using setitimer() so it can be used in production with minimal overhead.
=== Profiling the Ruby VM and C extensions
To profile C code, download and build an unpatched perftools (libunwind or ./configure --enable-frame-pointers required on x86_64):
wget http://google-perftools.googlecode.com/files/google-perftools-1.2.tar.gz
tar zxvf google-perftools-1.2.tar.gz
cd google-perftools-1.2

./configure --prefix=/opt --disable-shared
make
sudo make install

export LD_PRELOAD=/opt/lib/libprofiler.so                 # for linux
export DYLD_INSERT_LIBRARIES=/opt/lib/libprofiler.dylib   # for osx
CPUPROFILE=/tmp/ruby_interpreter.profile ruby -e' 5_000_000.times{ "hello world" } '

pprof `which ruby` --text /tmp/ruby_interpreter.profile
=== TODO
=== Resources
GoRuCo 2009 Lightning Talk on perftools.rb http://goruco2009.confreaks.com/30-may-2009-18-35-rejectconf-various-presenters.html at 21:52
Ilya Grigorik's introduction to perftools.rb http://www.igvita.com/2009/06/13/profiling-ruby-with-googles-perftools/
Google Perftools http://code.google.com/p/google-perftools/
Analyzing profiles and interpreting different output formats http://google-perftools.googlecode.com/svn/trunk/doc/cpuprofile.html#pprof
FAQs
Unknown package
We found that emerose-perftools.rb demonstrated a not healthy version release cadence and project activity because the last version was released a year ago. It has 1 open source maintainer collaborating on the project.
Did you know?

Socket for GitHub automatically highlights issues in each pull request and monitors the health of all your open source dependencies. Discover the contents of your packages and block harmful activity before you install or update your dependencies.
Security News
The MCP Steering Committee has launched the official MCP Registry in preview, a central hub for discovering and publishing MCP servers.
Product
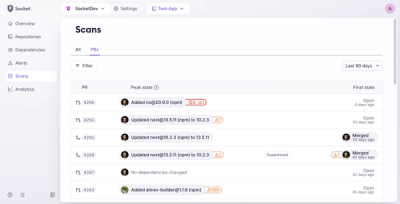
Socket’s new Pull Request Stories give security teams clear visibility into dependency risks and outcomes across scanned pull requests.
Research
/Security News
npm author Qix’s account was compromised, with malicious versions of popular packages like chalk-template, color-convert, and strip-ansi published.