Security News
Risky Biz Podcast: Making Reachability Analysis Work in Real-World Codebases
This episode explores the hard problem of reachability analysis, from static analysis limits to handling dynamic languages and massive dependency trees.
Dump C level and Ruby level backtrace from living ruby process or core file using gdb.
$ gem install gdbdump
sudo gdb must be allowed to dump backtrace of living ruby processIt was verified that gdbdump works with ruby executables built by rbenv/ruby-build.
Usage: gdbdump [options] [ pid | /path/to/ruby pid | /path/to/ruby core ]
    -d, --[no-]debug                 print debug log (default: false)
    -x, --gdbinit FILE               path to ruby repo's .gdbinit (default: some of ruby repo's .gdbinit is pre-bundle in this gem)
        --gdb PATH                   path to gdb command (default: gdb)
Default supported ruby versions: 2.1.x - 2.4.x
Ruby repo's .gdbinit file defines useful helper functions and it is maintained by ruby core team. gdbdump uses it. .gdbinit of some versions written on above are pre-bundled in this gem. But, if you want to use gdbdump for older or newer ruby versions:
-x optiongdbdump gem.With live ruby process of pid 1897,
$ gdbdump 1897
You will see C and Ruby level backtrace as:
$1 = (rb_vm_t *) 0x7f46bb071f20
* #<Thread:0x7f46bb0a5ee8 rb_thread_t:0x7f46bb0725d0 native_thread:0x7f46ba514740>
0x7f46ba16d700 <thread_join_m at thread.c:980>:in `join'
loop.rb:17:in `<main>'
* #<Thread:0x7f46bb202750 rb_thread_t:0x7f46bb3e03d0 native_thread:0x7f46b89c0700>
0x7f46ba0e4f30 <rb_f_sleep at process.c:4388>:in `sleep'
loop.rb:6:in `block (2 levels) in <main>'
0x7f46ba1a72b0 <rb_f_loop at vm_eval.c:1137>:in `loop'
loop.rb:4:in `block in <main>'
* #<Thread:0x7f46bb202660 rb_thread_t:0x7f46bb3e47e0 native_thread:0x7f46b87be700>
0x7f46ba0e4f30 <rb_f_sleep at process.c:4388>:in `sleep'
loop.rb:13:in `block (2 levels) in <main>'
0x7f46ba1a72b0 <rb_f_loop at vm_eval.c:1137>:in `loop'
loop.rb:11:in `block in <main>'
With core file, you have to specify path of ruby executable.
$ gdbdump $HOME/.rbenv/versions/2.4.1/bin/ruby core.1897
You can get a core file with gcore command as:
$ sudo gcore 1897
rb_ps defined in gdbinit. That's it.sigdump gem and require 'sigdump/setup' unlike gdbdump.gdbdump can replace gdbruby.After checking out the repo, run bin/setup to install dependencies. Then, run rake test to run the tests. You can also run bin/console for an interactive prompt that will allow you to experiment.
To install this gem onto your local machine, run bundle exec rake install. To release a new version, update the version number in version.rb, and then run bundle exec rake release, which will create a git tag for the version, push git commits and tags, and push the .gem file to rubygems.org.
Belows are my investigation notes about how to print C level and Ruby level backtrace via gdb.
CRuby itself has rb_print_backtrace function to print C level backtrace, and rb_backtrace function to print Ruby level backtrace. I first tried to use them.
However, they print a backtrace of only current thread. Furthermore, rb_print_backtrace supports printing outputs to only STDERR.
def print_backtrace
  run do |gdb|
    gdb.cmd_exec('call write(2, "== c backtrace ==\n", 18)')
    gdb.cmd_exec('call rb_print_backtrace()')
    gdb.cmd_exec('call write(2, "== ruby backtrace ==\n", 21)')
    gdb.cmd_exec('call rb_backtrace()')
  end
end
I secondly tried to use GDB's info threads and bt command to print C level backtrace. This was fine.
I also tried to print Ruby level backtrace by calling rb_eval_string with Ruby codes as:
def ruby_backtrace_code
  code = +%Q[File.open('#{dumpfile}', 'a') {|f|]
  code << %q[
    Thread.list.each {|th|
      f.write %Q[  Thread #{th} status=#{th.status} priority=#{th.priority}\n]
      th.backtrace.each {|bt|
        f.write %Q[      #{bt}\n]
      }
    }
  }]
  code.split("\n").map(&:strip).join('; ')
end

def print_backtrace
  run do |gdb|
    gdb.cmd_exec(%Q[call rb_eval_string("#{ruby_backtrace_code}")])
  end
end
However, the debugee (target) process got stuck after call rb_eval_string. It seemed the ruby process will be broken if ruby codes are executed via gdb.
I thirdly tried to use rb_ps function defined in .gdbinit of ruby repository to print C level and Ruby level backtrace of all threads.
Since .gdbinit is maintained by ruby core team, I do not need to follow changes of C level interfaces of CRuby as long as I follow .gdbinit.
The drawback of this way is that
.gdbinit in newer ruby versionsrb_ps takes somewhat long time like 2.6 seconds to print backtrace.Currently, I am taking this way.
Bug reports and pull requests are welcome on GitHub at https://github.com/sonots/gdbdump. This project is intended to be a safe, welcoming space for collaboration, and contributors are expected to adhere to the Contributor Covenant code of conduct.
The gem is available as open source under the terms of the MIT License.
Everyone interacting in the Gdbdump project’s codebases, issue trackers, chat rooms and mailing lists is expected to follow the code of conduct.
FAQs
Unknown package
We found that gdbdump demonstrated a not healthy version release cadence and project activity because the last version was released a year ago. It has 1 open source maintainer collaborating on the project.
Did you know?

Socket for GitHub automatically highlights issues in each pull request and monitors the health of all your open source dependencies. Discover the contents of your packages and block harmful activity before you install or update your dependencies.

Security News
This episode explores the hard problem of reachability analysis, from static analysis limits to handling dynamic languages and massive dependency trees.

Security News
/Research
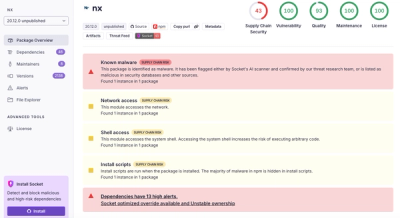
Malicious Nx npm versions stole secrets and wallet info using AI CLI tools; Socket’s AI scanner detected the supply chain attack and flagged the malware.

Security News
CISA’s 2025 draft SBOM guidance adds new fields like hashes, licenses, and tool metadata to make software inventories more actionable.