Security News
/Research
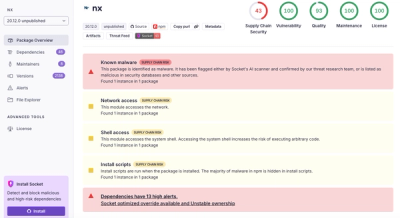
Wallet-Draining npm Package Impersonates Nodemailer to Hijack Crypto Transactions
Malicious npm package impersonates Nodemailer and drains wallets by hijacking crypto transactions across multiple blockchains.
via rubygems
gem install leafy-rack
or add to your Gemfile
gem 'leafy-rack
installing the gem also takes care of the jar dependencies with jruby-1.7.16+
there actually three parts to this gem
serializers to write out json data from the collected data of Leafy::Health::Registry and Leafy::Metrics::Registry
instrumented class which is almost like a rack middleware but is threadsafe and is meant to be shared with ALL requests. with this sharing in can count the number of active requests.
a collection of middleware
are using the internal API of Leafy::Health::Registry or Leafy::Metrics::Registry to run_health_checks or retrieve the collect metrics and produces the json representation of these data.
registry = Leafy::Health::Registry.new
json_writer = Leafy::Json::HealthWriter.new
json_writer.to_json( registry.health.run_health_checks )
or
registry = Leafy::Metrics::Registry.new
json_writer = Leafy::Json::MetricsWriter.new
json_writer.to_json( registry.metrics )
both json writers can take a second argument to generate pretty prints:
json_writer.to_json( registry.health.run_health_checks, true )
json_writer.to_json( registry.metrics, true )
the class Leafy::Instrumented::Instrumented has a call method which expect a block. the block needs to return the usual rack middleware result [status, headers, body].
typical usage of this inside a rack-middleware
metrics = Leafy::Metrics::Registry.new
instrumented = Leafy::Instrumented::Instrumented.new( metrics, 'myapp' )
instrumented.call do
   @app.call( env )
end
see the Leafy::Rack::Instrumented for an example.
metrics = Leafy::Metrics::Registry.new
use Leafy::Rack::Instrumented, Leafy::Instrumented::Instrumented.new( metrics, 'webapp' )
note: when this instrumented middleware gets configured after any of the admin middleware (see below) then those admin requests are not going into the instrumented metrics.
json data of a snapshot of metrics are under the path /metrics
metrics = Leafy::Metrics::Registry.new
use Leafy::Rack::Metrics, metrics
or with custom path
metrics = Leafy::Metrics::Registry.new
use Leafy::Rack::Metrics, metrics, '/admin/metrics'
json data of current health are under the path /health
health = Leafy::Health::Registry.new
use Leafy::Rack::Health, health
or with custom path
health = Leafy::Health::Registry.new
use Leafy::Rack::Health, health, '/admin/health'
the json response looks like
{
  "deadlock": {
    "healthy": true,
    "message": null
  },
  "elasticsearch": {
    "healthy": false,
    "message": 'error'
  }
}
if you want to add host info to your health report you can do so by adding the respective data to the middleware
Leafy::Rack::Health.hostinfo[ 'version' ] = '1.0'
Leafy::Rack::Health.hostinfo[ 'env' ] = 'staging'
then the json response has slightly different structure
 {
   "host": {
     "version": "",
     "hostname": "localhost",
     "env": "boot",
   },
   "checks": {
      "deadlock": {
        "healthy": true,
        "message": null
      }
    }
  }
under the path /ping
use Leafy::Rack::Ping
or with custom path
use Leafy::Rack::Ping, '/admin/ping'
under the path /threads
use Leafy::Rack::ThreadDump
or with custom path
use Leafy::Rack::ThreadDump, '/admin/threads'
a simple page with links to metrics, health, ping and thread-dump data under the path /admin
metrics = Leafy::Metrics::Registry.new
health = Leafy::Health::Registry.new

use Leafy::Rack::Admin, metrics, health
or with custom path
metrics = Leafy::Metrics::Registry.new
health = Leafy::Health::Registry.new

use Leafy::Rack::Admin, metrics, health, '/hidden/admin'
there is an example sinatra application which uses admin and instrumented middleware and adds some extra metrics inside the application.
get all the gems and jars in place
gem install jar-dependencies --development
bundle install
please make sure you are using jar-dependencies > 0.1.8 !
for running all specs
rake
or
rspec spec/reporter_spec.rb
FAQs
Unknown package
We found that leafy-rack demonstrated a not healthy version release cadence and project activity because the last version was released a year ago. It has 1 open source maintainer collaborating on the project.
Did you know?

Socket for GitHub automatically highlights issues in each pull request and monitors the health of all your open source dependencies. Discover the contents of your packages and block harmful activity before you install or update your dependencies.

Security News
/Research
Malicious npm package impersonates Nodemailer and drains wallets by hijacking crypto transactions across multiple blockchains.

Security News
This episode explores the hard problem of reachability analysis, from static analysis limits to handling dynamic languages and massive dependency trees.

Security News
/Research
Malicious Nx npm versions stole secrets and wallet info using AI CLI tools; Socket’s AI scanner detected the supply chain attack and flagged the malware.