Research
/Security News
Critical Vulnerability in NestJS Devtools: Localhost RCE via Sandbox Escape
A flawed sandbox in @nestjs/devtools-integration lets attackers run code on your machine via CSRF, leading to full Remote Code Execution (RCE).
microsoft-sentinel-log-analytics-logstash-output-plugin
Advanced tools
Microsoft Sentinel provides a new output plugin for Logstash. Use this output plugin to send any log via Logstash to the Microsoft Sentinel/Log Analytics workspace. This is done with the Log Analytics DCR-based API. You may send logs to custom or standard tables.
Plugin version: v1.1.3
Released on: 2024-10-10
This plugin is currently in development and is free to use. We welcome contributions from the open source community on this project, and we request and appreciate feedback from users.
Microsoft Sentinel provides Logstash output plugin to Log analytics workspace using DCR based logs API.
The plugin is published on RubyGems. To install to an existing logstash installation, run logstash-plugin install microsoft-sentinel-log-analytics-logstash-output-plugin.
If you do not have a direct internet connection, you can install the plugin to another logstash installation, and then export and import a plugin bundle to the offline host. For more information, see Logstash Offline Plugin Management instruction.
Microsoft Sentinel's Logstash output plugin supports the following versions
Please note that when using Logstash 8, it is recommended to disable ECS in the pipeline. For more information refer to Logstash documentation.
To create a sample file, follow the following steps:
output {
    microsoft-sentinel-log-analytics-logstash-output-plugin {
        create_sample_file => true
        sample_file_path => "<enter the path to the file in which the sample data will be written>" #for example: "c:\\temp" (for windows) or "/var/log" for Linux.
    }
}
Note: make sure that the path exists before creating the sample file. 2) Start Logstash. The plugin will collect up to 10 records to a sample. 3) The file named "sampleFile.json" in the configured path will be created once there are 10 events to sample or when the Logstash process exited gracefully. (for example: "c:\temp\sampleFile1648453501.json").
The following parameters are optional and should be used to create a sample file.
input {
      generator {
        lines => [ "This is a test log message"]
        count => 10
      }
}

output {
    microsoft-sentinel-log-analytics-logstash-output-plugin {
        create_sample_file => true
        sample_file_path => "<enter the path to the file in which the sample data will be written>" #for example: "c:\\temp" (for windows) or "/var/log" for Linux.
    }
}
[
	{
		"host": "logstashMachine",
		"sequence": 0,
		"message": "This is a test log message",
		"ls_timestamp": "2022-10-29T13:19:28.116Z",
		"ls_version": "1"
	},
	...
]
To configure Microsoft Sentinel Logstash plugin you first need to create the DCR-related resources. To create these resources, follow one of the following tutorials:
Use the tutorial from the previous section to retrieve the following attributes:
After retrieving the required values replace the output section of the Logstash configuration file created in the previous steps with the example below. Then, replace the strings in the brackets below with the corresponding values. Make sure you change the "create_sample_file" attribute to false.
Here is an example for the output plugin configuration section:
output {
    microsoft-sentinel-log-analytics-logstash-output-plugin {
        client_app_Id => "<enter your client_app_id value here>"
        client_app_secret => "<enter your client_app_secret value here>"
        tenant_id => "<enter your tenant id here>"
        data_collection_endpoint => "<enter your DCE logsIngestion URI here>"
        dcr_immutable_id => "<enter your DCR immutableId here>"
        dcr_stream_name => "<enter your stream name here>"
        create_sample_file=> false
        sample_file_path => "c:\\temp"
    }
}
Security notice: We recommend not to implicitly state client_app_Id, client_app_secret, tenant_id, data_collection_endpoint, and dcr_immutable_id in your Logstash configuration for security reasons. It is best to store this sensitive information in a Logstash KeyStore as described here- 'Secrets Keystore'
Here is an example configuration that parses Syslog incoming data into a custom stream named "Custom-MyTableRawData".
input {
    beats {
        port => "5044"
    }
}
 filter {
}
output {
    microsoft-sentinel-log-analytics-logstash-output-plugin {
      client_app_Id => "619c1731-15ca-4403-9c61-xxxxxxxxxxxx"
      client_app_secret => "xxxxxxxxxxxxxxxx"
      tenant_id => "72f988bf-86f1-41af-91ab-xxxxxxxxxxxx"
      data_collection_endpoint => "https://my-customlogsv2-test-jz2a.eastus2-1.ingest.monitor.azure.com"
      dcr_immutable_id => "dcr-xxxxxxxxxxxxxxxxac23b8978251433a"
      dcr_stream_name => "Custom-MyTableRawData"
      proxy_aad => "http://proxy.example.com"
    }
}
input {
    tcp {
        port => "514"
        type => syslog #optional, will effect log type in table
    }
}
 filter {
}
output {
    microsoft-sentinel-log-analytics-logstash-output-plugin {
      client_app_Id => "619c1731-15ca-4403-9c61-xxxxxxxxxxxx"
      client_app_secret => "xxxxxxxxxxxxxxxx"
      tenant_id => "72f988bf-86f1-41af-91ab-xxxxxxxxxxxx"
      data_collection_endpoint => "https://my-customlogsv2-test-jz2a.eastus2-1.ingest.monitor.azure.com"
      dcr_immutable_id => "dcr-xxxxxxxxxxxxxxxxac23b8978251433a"
      dcr_stream_name => "Custom-MyTableRawData"
    }
}
Advanced Configuration
input {
  syslog {
    port => 514
  }
}

output {
    microsoft-sentinel-log-analytics-logstash-output-plugin {
      client_app_Id => "${CLIENT_APP_ID}"
      client_app_secret => "${CLIENT_APP_SECRET}"
      tenant_id => "${TENANT_ID}"
      data_collection_endpoint => "${DATA_COLLECTION_ENDPOINT}"
      dcr_immutable_id => "${DCR_IMMUTABLE_ID}"
      dcr_stream_name => "Custom-MyTableRawData"
	  key_names => ['PRI','TIME_TAG','HOSTNAME','MSG']
    }
}
Now you are able to run logstash with the example configuration and send mock data using the 'logger' command.
For example:
logger -p local4.warn --rfc3164 --tcp -t CEF "0|Microsoft|Device|cef-test|example|data|1|here is some more data for the example" -P 514 -d -n 127.0.0.1
Which will produce this content in the sample file:
[
	{
		"logsource": "logstashMachine",
		"facility": 20,
		"severity_label": "Warning",
		"severity": 4,
		"timestamp": "Apr  7 08:26:04",
		"program": "CEF:",
		"host": "127.0.0.1",
		"facility_label": "local4",
		"priority": 164,
		"message": "0|Microsoft|Device|cef-test|example|data|1|here is some more data for the example",
		"ls_timestamp": "2022-04-07T08:26:04.000Z",
		"ls_version": "1"
	}
]
When using Logstash installed on a Docker image of Lite Ubuntu, the following warning may appear:
java.lang.RuntimeException: getprotobyname_r failed
To resolve it, use the following commands to install the netbase package within your Dockerfile:
USER root
RUN apt install netbase -y
For more information, see JNR regression in Logstash 7.17.0 (Docker).
If your environment's event rate is low considering the number of allocated Logstash workers, we recommend increasing the value of plugin_flush_interval to 60 or more. This change will allow each worker to batch more events before uploading to the Data Collection Endpoint (DCE). You can monitor the ingestion payload using DCR metrics. For more information on plugin_flush_interval, see the Optional Configuration table mentioned earlier.
FAQs
Unknown package
We found that microsoft-sentinel-log-analytics-logstash-output-plugin demonstrated a healthy version release cadence and project activity because the last version was released less than a year ago. It has 1 open source maintainer collaborating on the project.
Did you know?

Socket for GitHub automatically highlights issues in each pull request and monitors the health of all your open source dependencies. Discover the contents of your packages and block harmful activity before you install or update your dependencies.

Research
/Security News
A flawed sandbox in @nestjs/devtools-integration lets attackers run code on your machine via CSRF, leading to full Remote Code Execution (RCE).

Product
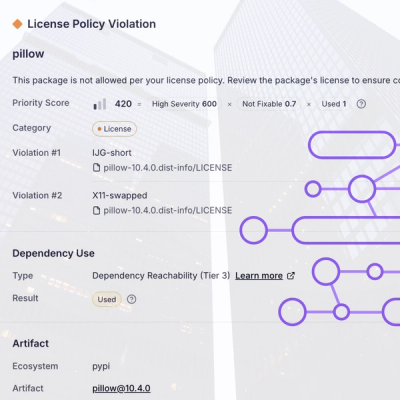
Customize license detection with Socket’s new license overlays: gain control, reduce noise, and handle edge cases with precision.

Product
Socket now supports Rust and Cargo, offering package search for all users and experimental SBOM generation for enterprise projects.