ModelsStats
Graphics for your rails models. It may show count(or average, or sum, or another sql agregate function) of models for each day with grouping, conditions.
For graphics it uses for your choice MetricsGraphics.js or/and NVD3.
Dependencies: Redis for store statistics.
D3, jQuery, Bootstrap it's dependencies of MetricsGraphics.js.
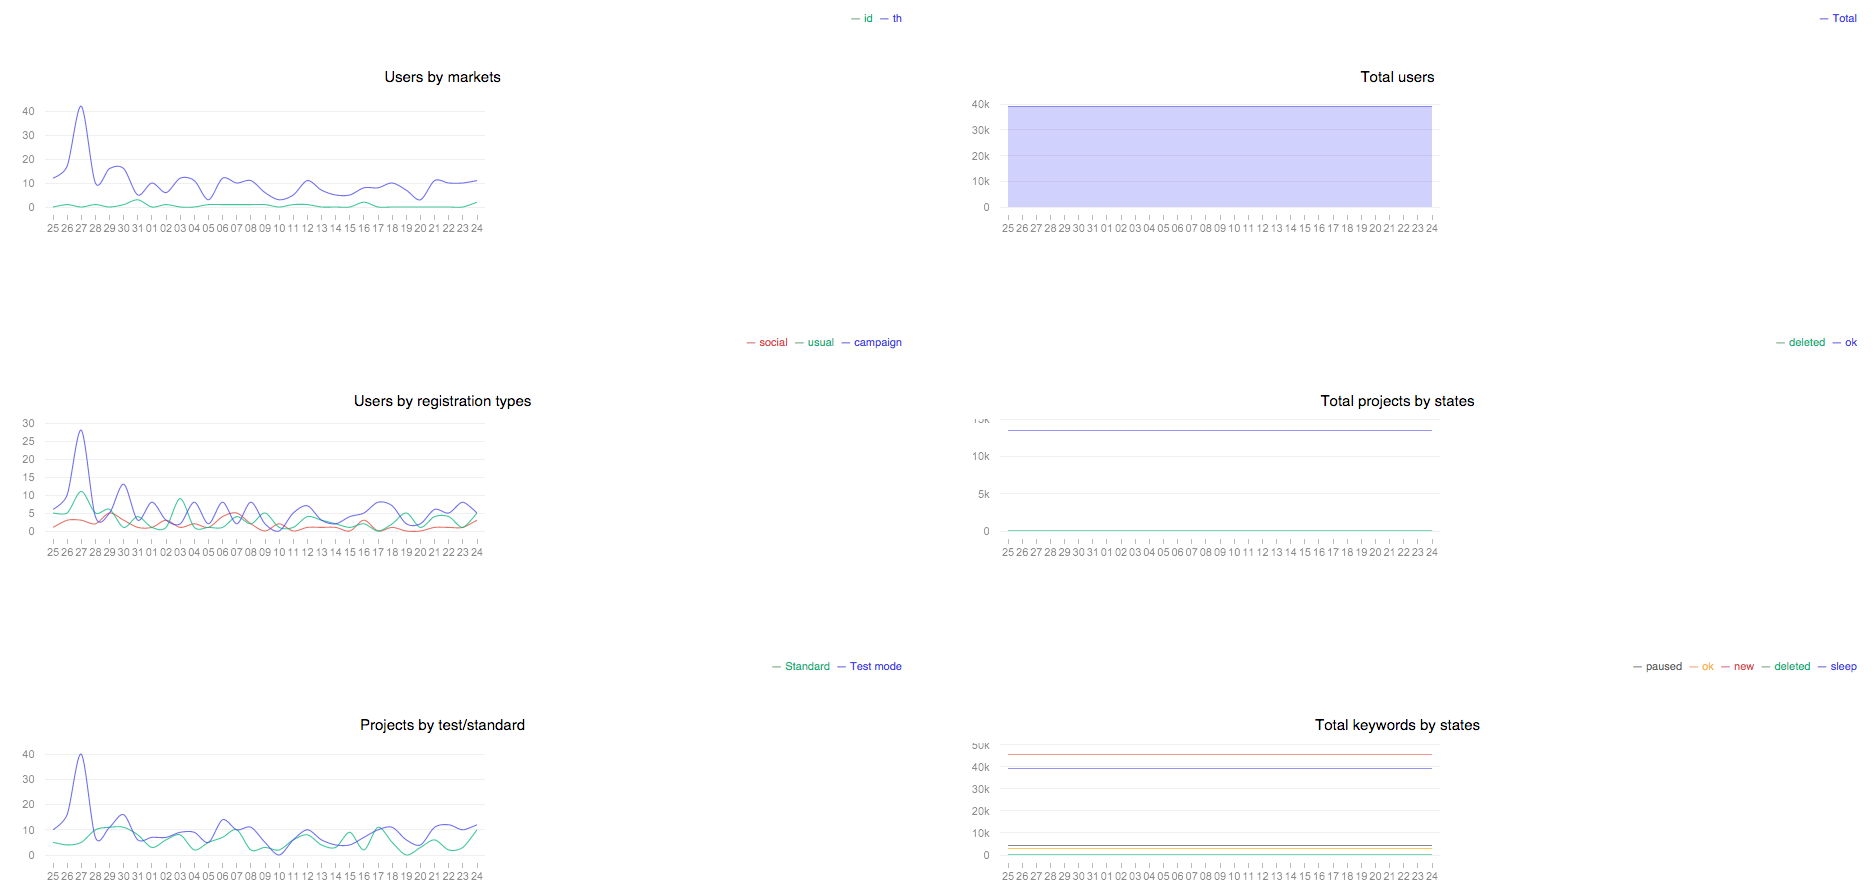
Preview:
NVD3:
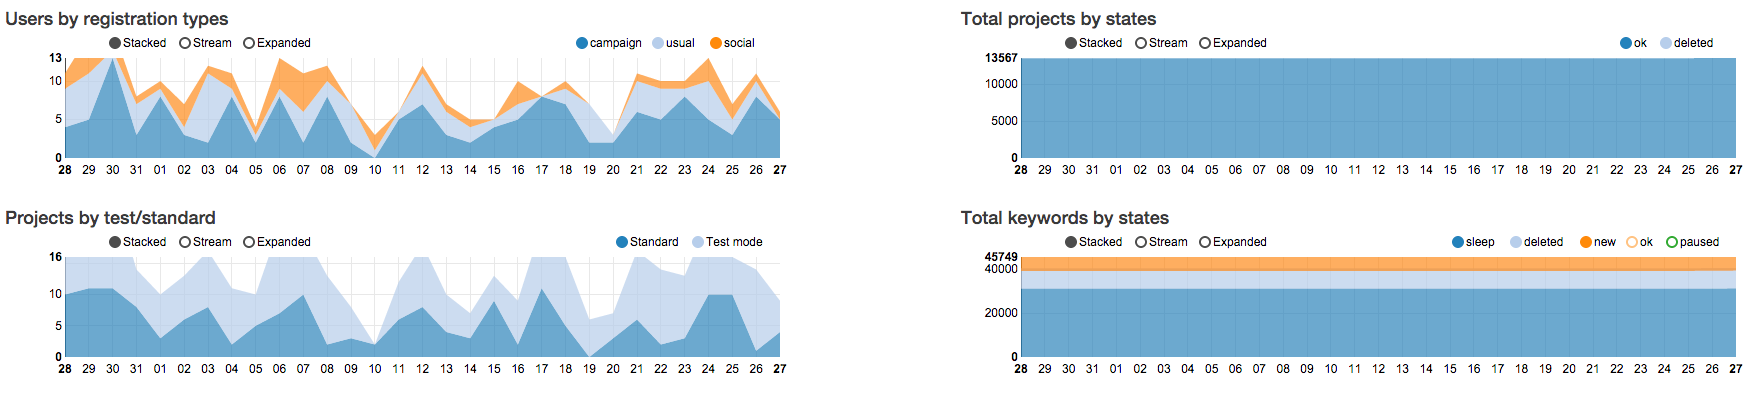
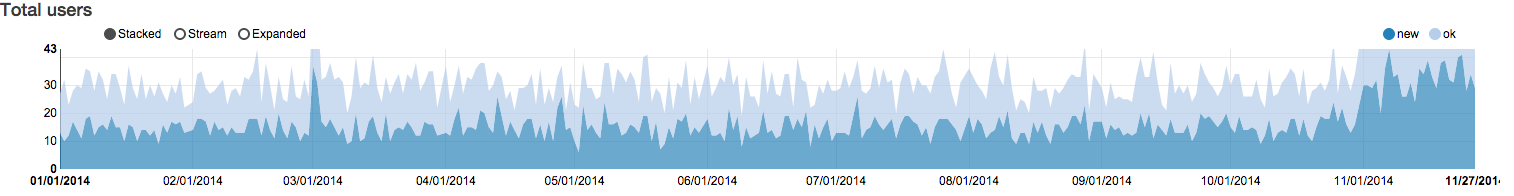
MetricsGraphics.js
Installation
Add this line to your application's Gemfile:
gem 'models_stats', github: 'accessd/models_stats'
And then execute:
$ bundle
In your application.js manifest:
//= require models_stats/nvd3
or/and
//= require models_stats/metrics_graphics
if you want use MetricsGraphics.
In your application.css.scss manifest:
//= require models_stats/nvd3
or/and
//= require models_stats/metrics_graphics
if you want use MetricsGraphics.
Also if you use MetricsGraphics.js you must have jQuery and Bootstrap js/css included.
Usage
Configuration
Add config file config/models_stats.yml, for example:
minimal configuration:
  ---
  - total_users:
      description: "Total users"
      model: User
it would be calculate total users for day.
Enhanced configuration:
---
- total_links_by_error_types:
description: "Total links by error types"
model: Link
datetime_attr: :created_at
group_by: :error_type_id
conditions: "error_type_id != <%= Link::NO_ERROR %>"
group_by_values_map: <%= ModelsStats.convert_hash_to_yaml(Link::ERROR_NAMES) %>
graph_width: 430
graph_height: 140
graphic_lib: nvd3
graphic_type: stacked
date_tick: day
date_format: '%d/%m'
- average_by_keyword_positions:
description: "Average by keyword positions"
select_statement: "AVG(google_position) AS count"
model: KeywordPosition
If you want using specific redis for store statistics, set it in config/initializers/models_stats.rb, for example:
ModelsStats.redis_connection = Redis.new(host: '127.0.0.1', port: 6379, db: 5)
Default graphics library can be configured through:
ModelsStats.default_lib_for_graphics = :nvd3 # Or metrics_graphics
Default graphics type:
ModelsStats.default_graphics_type = :line # Or stacked
Default graph width:
ModelsStats.default_graphics_width = 500
Default graph height:
ModelsStats.default_graphics_height = 120
Default date tick:
ModelsStats.default_date_tick = :day # Or month, week
Default date format:
ModelsStats.default_date_format = '%d/%m'
For the full list of directives for formatting time, refer to this list
Collecting statistics
Add to your crontab(may use whenever) rake task models_stats:collect_stat_for_yesterday, run it at 00:00 or later and it will collect statistics for yesterday.
For collecting statistics for last month run rake task models_stats:collect_stat_for_last_month.
Also you may collect statistics for specific date and config, for example:
date = 2.days.ago.to_date
statistics_alias = 'total_links_by_error_types'
ModelsStats::StatisticsCollector.new.collect(statistics_alias, date)
Display graphics
In your views use helpers:
Render single graphic for total_links_by_error_types statistic alias(which you define in config/models_stats.yml) and last week
= render_models_stats_graph('total_links_by_error_types', 1.week) # By default period is 1.month
Render all defined graphics splited by two columns - first for new models count, second for total models count
= render_models_stats_dashboard
Contributing
- Fork it ( https://github.com/accessd/models_stats/fork )
- Create your feature branch (
git checkout -b my-new-feature)
- Commit your changes (
git commit -am 'Add some feature')
- Push to the branch (
git push origin my-new-feature)
- Create a new Pull Request