Security News
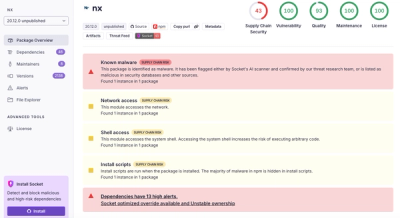
Nx npm Packages Compromised in Supply Chain Attack Weaponizing AI CLI Tools
Malicious Nx npm versions stole secrets and wallet info using AI CLI tools; Socket’s AI scanner detected the supply chain attack and flagged the malware.
sidekiq-memory_logger
Advanced tools
Have you ever seen massive memory increases in your Sidekiq workers? Well, this gem helps you figure out which job is causing it.
Memory measurement is handled by the get_process_mem gem, which works across all platforms (Windows, macOS, Linux) and both inside and outside of containers. Object allocation tracking uses Ruby's built-in GC.stat[:total_allocated_objects].
By default, this gem just logs at info level for every job:
[MemoryLogger] job=MyJob queue=default memory_mb=15.2 objects=12345
You can also parse this log and create a metric (e.g. with Sumo or Datadog) or change the callback we use (see Configuration below) to create metrics.
[!WARNING] Each job runs on its own thread, but all threads share the same process heap. Since memory measurement is performed at the process level, concurrent job execution can lead to inaccurate memory attribution, since the measured memory usage will include memory increases from other jobs running simultaneously. For example, two jobs running at the same time will report the same memory increase, although only one of those jobs may have allocated any memory at all.
Workaround: To work around this limitation, collect a large enough sample size and use 95th percentile or maximum metrics along with detailed logging to identify which job classes consistently reproduce memory issues. This statistical approach will help you identify problematic jobs despite the measurement noise from concurrent execution.
gem 'sidekiq-memory_logger'
You must add the middleware to your Sidekiq server configuration:
# config/initializers/sidekiq.rb or similar
Sidekiq.configure_server do |config|
  config.server_middleware do |chain|
    chain.add Sidekiq::MemoryLogger::Middleware
  end
end
You're now ready to go.
It will just work out of the box, but you can change some of your behavior if you like.
# config/initializers/sidekiq_memory_logger.rb or similar
Sidekiq::MemoryLogger.configure do |config|
  # Change the logger (default uses Rails.logger if available, otherwise stdout)
  config.logger = MyCustomLogger.new

  # Specify which queues to monitor (empty array monitors all queues)
  config.queues = ["critical", "mailers"]  # Only monitor these queues
  # config.queues = []  # Monitor all queues (default)

  # Replace the default logging callback with custom behavior
  # The callback now receives job arguments as the 5th parameter
  config.callback = ->(job_class, queue, memory_diff_mb, objects_diff, args) do
    # Example: Extract company_id from job arguments
    # Assuming your job is called like: ProcessCompanyDataJob.perform_async(company_id, other_params)
    company_id = args&.first

    # StatsD example with company_id
    StatsD.histogram('sidekiq.memory_usage', memory_diff_mb, tags: {
      job_class: job_class,
      queue: queue,
      company_id: company_id
    })

    # Log with company context
    Rails.logger.info "Job #{job_class} for company #{company_id} on queue #{queue} used #{memory_diff_mb} MB"

    # Dogstatsd example
    # $dogstatsd.histogram('sidekiq.memory_usage', memory_diff_mb, tags: [
    #   "job_class:#{job_class}",
    #   "queue:#{queue}",
    #   "company_id:#{company_id}"
    # ])

    # New Relic example
    # NewRelic::Agent.record_metric("Custom/Sidekiq/MemoryUsage/#{queue}/#{job_class}", memory_diff_mb)
    # NewRelic::Agent.add_custom_attributes({
    #   'sidekiq.job_class' => job_class,
    #   'sidekiq.queue' => queue,
    #   'sidekiq.company_id' => company_id
    # })

    # Datadog tracing example - add attributes to current span
    # span = Datadog::Tracing.active_span
    # if span
    #   span.set_tag('sidekiq.memory_usage_mb', memory_diff_mb)
    #   span.set_tag('sidekiq.job_class', job_class)
    #   span.set_tag('sidekiq.queue', queue)
    #   span.set_tag('sidekiq.company_id', company_id)
    # end
  end

  # The default callback logs memory usage like this:
  # config.callback = ->(job_class, queue, memory_diff_mb, objects_diff, args) do
  #   config.logger.info("[MemoryLogger] job=#{job_class} queue=#{queue} memory_mb=#{memory_diff_mb}")
  # end

  # If you want custom metrics AND logging, include both in your callback:
  config.callback = ->(job_class, queue, memory_diff_mb, objects_diff, args) do
    # Your custom metrics collection
    StatsD.histogram('sidekiq.memory_usage', memory_diff_mb, tags: {
      job_class: job_class,
      queue: queue
    })

    # Include logging if you still want it
    Rails.logger.info "Job #{job_class} on queue #{queue} used #{memory_diff_mb} MB"
  end
end
The memory logger middleware introduces some performance overhead due to memory measurement and callback execution. We continuously benchmark this overhead using the official sidekiqload tool.
According to our benchmarks running in Github Actions (view workflow), the middleware adds ~0.16ms of latency per job. The memory footprint increase is negligible. Consider this overhead when deciding whether to enable the middleware in high-throughput production environments. Use the queues config setting to limit this middleware to only the queues you're trying to debug.
FAQs
Unknown package
We found that sidekiq-memory_logger demonstrated a healthy version release cadence and project activity because the last version was released less than a year ago. It has 1 open source maintainer collaborating on the project.
Did you know?

Socket for GitHub automatically highlights issues in each pull request and monitors the health of all your open source dependencies. Discover the contents of your packages and block harmful activity before you install or update your dependencies.

Security News
Malicious Nx npm versions stole secrets and wallet info using AI CLI tools; Socket’s AI scanner detected the supply chain attack and flagged the malware.

Security News
CISA’s 2025 draft SBOM guidance adds new fields like hashes, licenses, and tool metadata to make software inventories more actionable.

Security News
A clarification on our recent research investigating 60 malicious Ruby gems.