Product
Reachability for Ruby Now in Beta
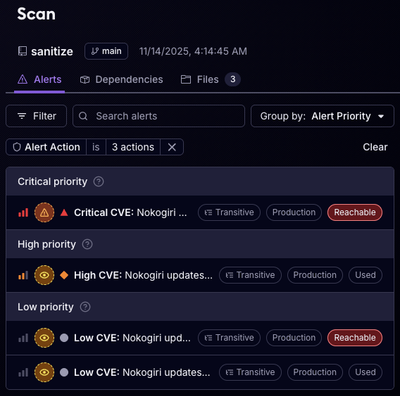
Reachability analysis for Ruby is now in beta, helping teams identify which vulnerabilities are truly exploitable in their applications.
By Oskar Haarklou Veileborg - Nov 17, 2025
= tracing
Tracing provides a single method call trace which is used in a number of ways to generated highly configurable nested tracing output from your program. Each trace key is defined by a symbolic keyword, which is enabled by including it in a comma-separated list in the TRACE environment variable.
== INSTALL:
== USAGE:
require 'tracing'
When trace is called with no arguments, it returns the Tracer singleton object. The API of this object is defined below. You probably don't need to use this.
If called with one argument, that should be a Symbol, which is the trace key. Nothing is printed, and the return value is true if this trace key is enabled.
Normal calls to trace take two or more arguments, and an optional block.
The first argument is a Symbol, which is the trace key.
The second and any subsequent arguments are either a String (or anything that can be joined) or a Proc (or anything which can be called), which is evaluated and printed if the trace key is enabled.
If a block is passed, the nesting level is increased (if this key was enabled), the block is called, and trace returns its return value (restoring the nesting).
== SPECIAL TRACE KEYS
Specific TRACE keys configure internal behaviour:
debug pre-loads a Ruby debugger at the start of the run, so it has the full context available
help runs the program, and at exit, prints all trace keys that were available during that run.
keys causes each output line to be prefixed by its trace key
all enables all trace keys (this also enables keys)
firstaid enter the debugger inside the Exception constructor so you can inspect the local context
trap trap SIGINT (^C) in a block that allows inspecting or continuing execution (not all debuggers support this)
flame - use ruby-prof-flamegraph to display the performance profile as a flame graph using SVG
The debugger is chosen from ENV['DEBUG_PREFERENCE'] or the first to load of: byebug, pry. debugger, ruby-trace
== TRACER API
The Tracer supports the following methods:
reinitialize() clear all trace keys and re-initialise from the TRACE enfironment variable
available_keys() returns an array of the keys seen so far this run
enabled?(key) returns true if key is enabled
enabled() returns an array of all enabked keys
enable(key) enables that key
disable(key) disables that key
toggle(key) toggles that key
display(string) prints the string to standard output. You can monkey-patch this to divert the output.
== Contributing to tracing
== Copyright
Copyright (c) 2016 Clifford Heath. See LICENSE.txt for further details.
FAQs
Unknown package
We found that tracing demonstrated a healthy version release cadence and project activity because the last version was released less than a year ago. It has 1 open source maintainer collaborating on the project.
Did you know?

Socket for GitHub automatically highlights issues in each pull request and monitors the health of all your open source dependencies. Discover the contents of your packages and block harmful activity before you install or update your dependencies.
Product
Reachability analysis for Ruby is now in beta, helping teams identify which vulnerabilities are truly exploitable in their applications.

Research
/Security News
Malicious npm packages use Adspect cloaking and fake CAPTCHAs to fingerprint visitors and redirect victims to crypto-themed scam sites.

Security News
Recent coverage mislabels the latest TEA protocol spam as a worm. Here’s what’s actually happening.