

Product
Introducing Reachability for PHP
Reachability analysis for PHP is now available in experimental, helping teams identify which vulnerabilities are actually exploitable.
By Benjamin Barslev - Apr 24, 2026
April 11, 2024
2 min read

Today, we are excited to introduce the first of many improvements to how you view the state of your dependencies. Our goal is to make you more efficient when looking through your projects by providing tools designed to spotlight issues that need attention.
We've been busy adding ways to filter dependencies by alert severity among other things - a requirement for long lists of dependencies. However, even with all of these filtering tools, to get a sense of a project's state you must dig through potentially many pages of dependencies. With that in mind, we've been thinking about how to concisely display the overall state of a project. Some projects have a ton of dependencies - if you've ever worked on or seen a modern web front-end codebase, you know what we're talking about.
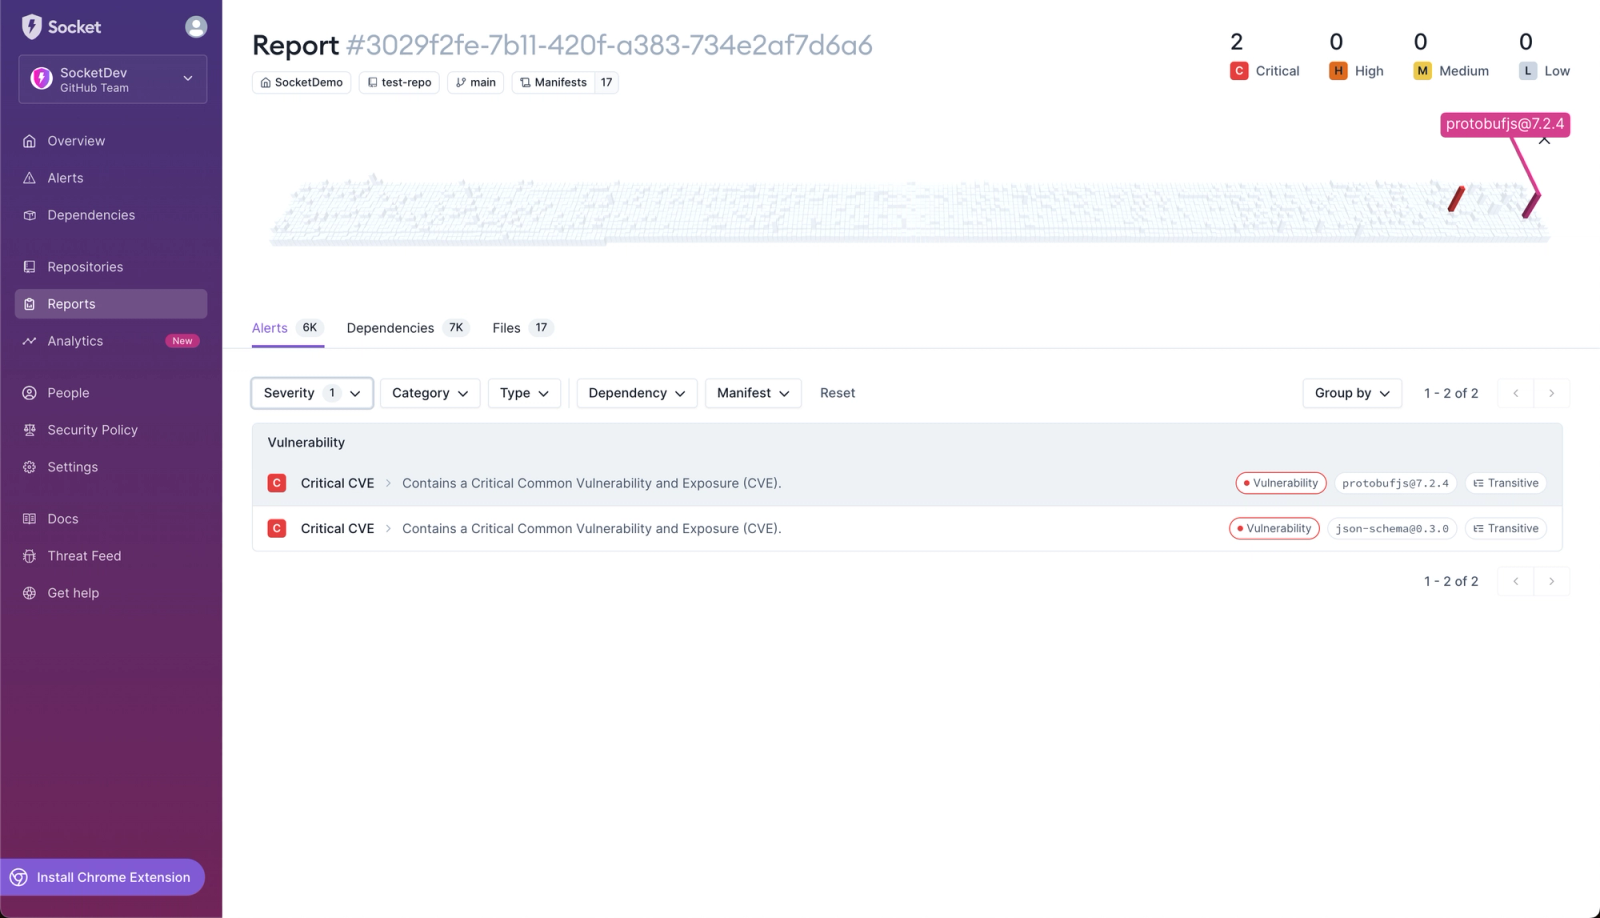
We decided to focus on a visualization for the SBOM report page — a grid of packages, displayed as boxes, where the box height and color represent their level of risk. For example, we want packages with critical alerts to stick out like a sore thumb. Although you can figure out the state of a project manually by clicking through the alerts, this visualization gives you a quick impression without getting lost in the details.
This grid of boxes is a set of all the unique dependencies in your project with heights correlating to risk. Dependencies with critical alerts are represented in the brightest color and packages without problems fade into the background (light gray).
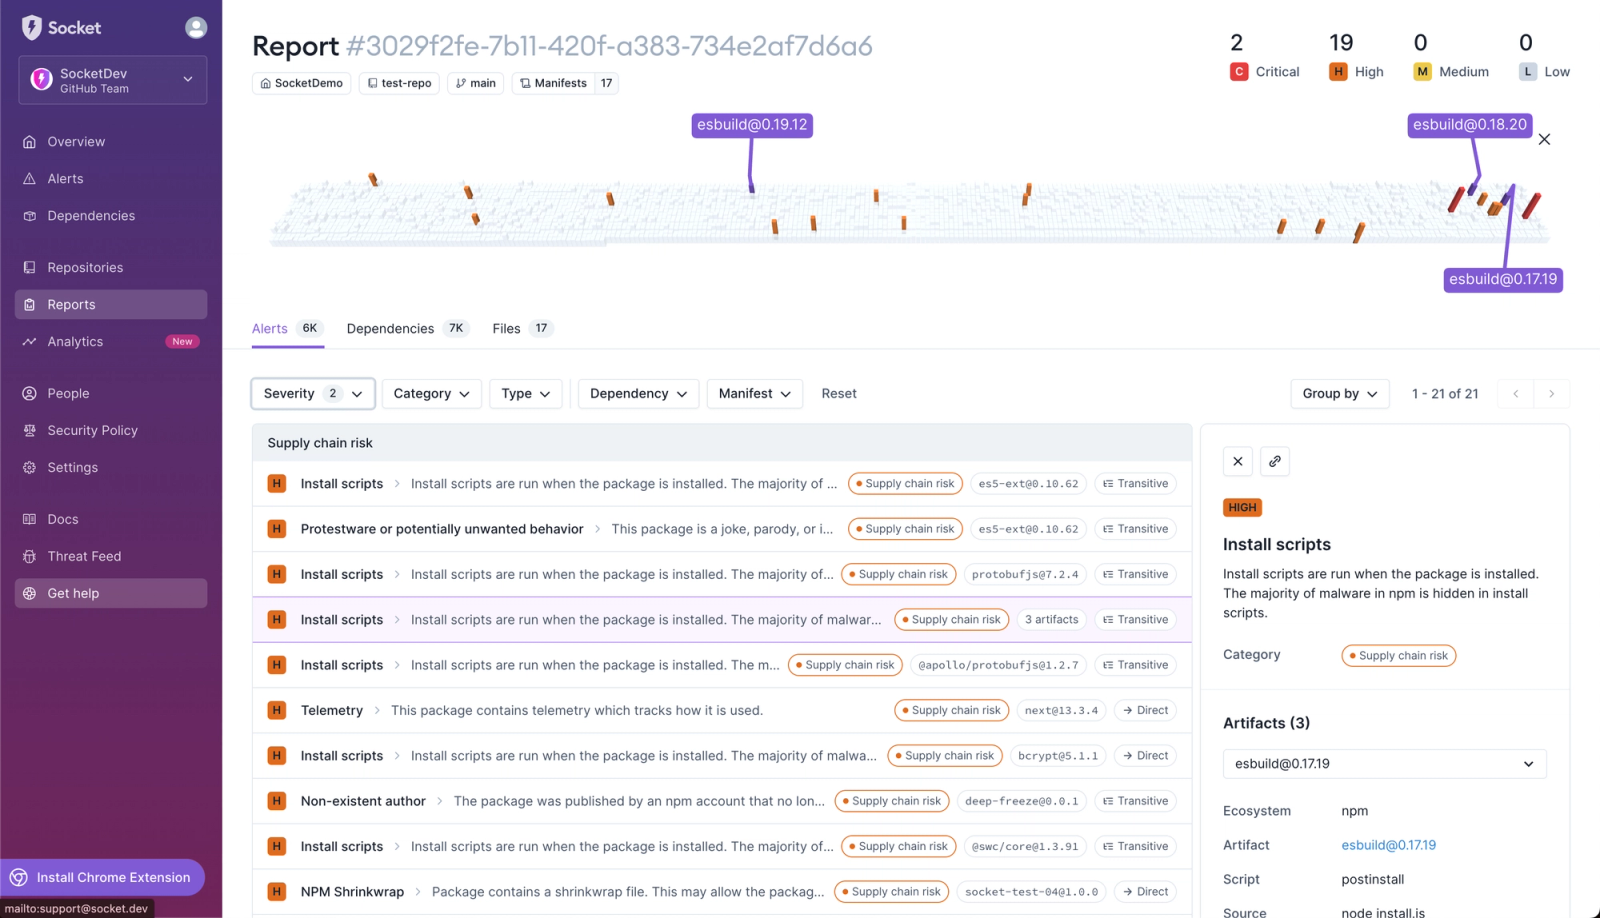
Of course dependencies can still be filtered in the Alerts and Dependencies tabs and the 3D view will be updated to match.
While on the Alerts tab, clicking on individual boxes in the 3D view will open the associated alert details. Other packages with the same alert will also be selected.
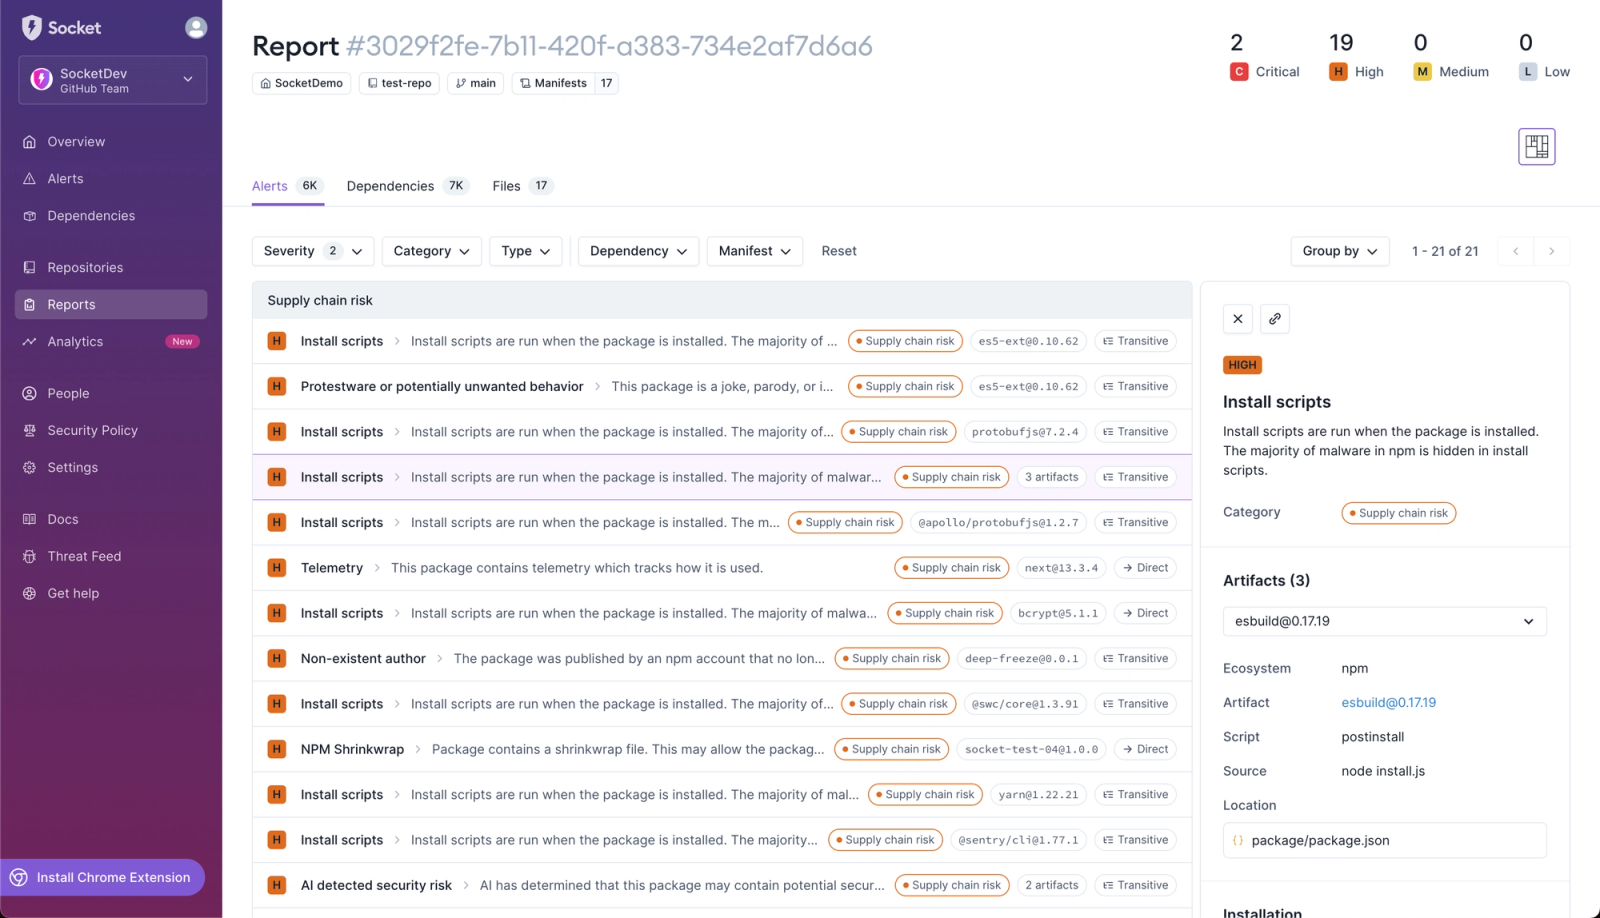
To disable the visualization, you can use the X on the left. This will replace it with a button that can be used to enable it again.
We're excited to see how this visualization helps you efficiently identify and resolve problems within your projects, so you can get back to confidently building the technology of tomorrow.
Subscribe to our newsletter
Get notified when we publish new security blog posts!
Product
Reachability analysis for PHP is now available in experimental, helping teams identify which vulnerabilities are actually exploitable.

Product
Export Socket alert data to your own cloud storage in JSON, CSV, or Parquet, with flexible snapshot or incremental delivery.
Product
Stay on top of alert changes with filtered subscriptions, batched summaries, and notification routing built for triage.