Security News
MCP Steering Committee Launches Official MCP Registry in Preview
The MCP Steering Committee has launched the official MCP Registry in preview, a central hub for discovering and publishing MCP servers.
github.com/dominikbraun/graph

A library for creating generic graph data structures and modifying, analyzing, and visualizing them.
Are you using graph? Check out the graph user survey.
int or City.Store implementation.Status: Because
graphis in version 0, the public API shouldn't be considered stable.
This README may contain unreleased changes. Check out the latest documentation.
go get github.com/dominikbraun/graph
g := graph.New(graph.IntHash)

_ = g.AddVertex(1)
_ = g.AddVertex(2)
_ = g.AddVertex(3)
_ = g.AddVertex(4)
_ = g.AddVertex(5)

_ = g.AddEdge(1, 2)
_ = g.AddEdge(1, 4)
_ = g.AddEdge(2, 3)
_ = g.AddEdge(2, 4)
_ = g.AddEdge(2, 5)
_ = g.AddEdge(3, 5)
g := graph.New(graph.IntHash, graph.Directed(), graph.Acyclic())

_ = g.AddVertex(1)
_ = g.AddVertex(2)
_ = g.AddVertex(3)
_ = g.AddVertex(4)

_ = g.AddEdge(1, 2)
_ = g.AddEdge(1, 3)
_ = g.AddEdge(2, 3)
_ = g.AddEdge(2, 4)
_ = g.AddEdge(3, 4)
To understand this example in detail, see the concept of hashes.
type City struct {
    Name string
}

cityHash := func(c City) string {
    return c.Name
}

g := graph.New(cityHash)

_ = g.AddVertex(london)
g := graph.New(cityHash, graph.Weighted())

_ = g.AddVertex(london)
_ = g.AddVertex(munich)
_ = g.AddVertex(paris)
_ = g.AddVertex(madrid)

_ = g.AddEdge("london", "munich", graph.EdgeWeight(3))
_ = g.AddEdge("london", "paris", graph.EdgeWeight(2))
_ = g.AddEdge("london", "madrid", graph.EdgeWeight(5))
_ = g.AddEdge("munich", "madrid", graph.EdgeWeight(6))
_ = g.AddEdge("munich", "paris", graph.EdgeWeight(2))
_ = g.AddEdge("paris", "madrid", graph.EdgeWeight(4))
This example traverses and prints all vertices in the graph in DFS order.
g := graph.New(graph.IntHash, graph.Directed())

_ = g.AddVertex(1)
_ = g.AddVertex(2)
_ = g.AddVertex(3)
_ = g.AddVertex(4)

_ = g.AddEdge(1, 2)
_ = g.AddEdge(1, 3)
_ = g.AddEdge(3, 4)

_ = graph.DFS(g, 1, func(value int) bool {
    fmt.Println(value)
    return false
})
1 3 4 2
g := graph.New(graph.IntHash)

// Add vertices and edges ...

scc, _ := graph.StronglyConnectedComponents(g)

fmt.Println(scc)
[[1 2 5] [3 4 8] [6 7]]
g := graph.New(graph.StringHash, graph.Weighted())

// Add vertices and weighted edges ...

path, _ := graph.ShortestPath(g, "A", "B")

fmt.Println(path)
[A C E B]
g := graph.New(graph.StringHash, graph.Weighted())

// Add vertices and edges ...

mst, _ := graph.MinimumSpanningTree(g)
g := graph.New(graph.IntHash, graph.Directed(), graph.PreventCycles())

// Add vertices and edges ...

// For a deterministic topological ordering, use StableTopologicalSort.
order, _ := graph.TopologicalSort(g)

fmt.Println(order)
[1 2 3 4 5]
g := graph.New(graph.StringHash, graph.Directed(), graph.PreventCycles())

// Add vertices and edges ...

transitiveReduction, _ := graph.TransitiveReduction(g)
g := graph.New(graph.IntHash, graph.PreventCycles())

_ = g.AddVertex(1)
_ = g.AddVertex(2)
_ = g.AddVertex(3)

_ = g.AddEdge(1, 2)
_ = g.AddEdge(1, 3)

if err := g.AddEdge(2, 3); err != nil {
    panic(err)
}
panic: an edge between 2 and 3 would introduce a cycle
The following example will generate a DOT description for g and write it into the given file.
g := graph.New(graph.IntHash, graph.Directed())

_ = g.AddVertex(1)
_ = g.AddVertex(2)
_ = g.AddVertex(3)

_ = g.AddEdge(1, 2)
_ = g.AddEdge(1, 3)

file, _ := os.Create("./mygraph.gv")
_ = draw.DOT(g, file)
To generate an SVG from the created file using Graphviz, use a command such as the following:
dot -Tsvg -O mygraph.gv
The DOT function also supports rendering graph attributes:
_ = draw.DOT(g, file, draw.GraphAttribute("label", "my-graph"))
This graph has been rendered using the following program:
package main

import (
	"os"

	"github.com/dominikbraun/graph"
	"github.com/dominikbraun/graph/draw"
)

func main() {
	g := graph.New(graph.IntHash)

	_ = g.AddVertex(1, graph.VertexAttribute("colorscheme", "blues3"), graph.VertexAttribute("style", "filled"), graph.VertexAttribute("color", "2"), graph.VertexAttribute("fillcolor", "1"))
	_ = g.AddVertex(2, graph.VertexAttribute("colorscheme", "greens3"), graph.VertexAttribute("style", "filled"), graph.VertexAttribute("color", "2"), graph.VertexAttribute("fillcolor", "1"))
	_ = g.AddVertex(3, graph.VertexAttribute("colorscheme", "purples3"), graph.VertexAttribute("style", "filled"), graph.VertexAttribute("color", "2"), graph.VertexAttribute("fillcolor", "1"))
	_ = g.AddVertex(4, graph.VertexAttribute("colorscheme", "ylorbr3"), graph.VertexAttribute("style", "filled"), graph.VertexAttribute("color", "2"), graph.VertexAttribute("fillcolor", "1"))
	_ = g.AddVertex(5, graph.VertexAttribute("colorscheme", "reds3"), graph.VertexAttribute("style", "filled"), graph.VertexAttribute("color", "2"), graph.VertexAttribute("fillcolor", "1"))

	_ = g.AddEdge(1, 2)
	_ = g.AddEdge(1, 4)
	_ = g.AddEdge(2, 3)
	_ = g.AddEdge(2, 4)
	_ = g.AddEdge(2, 5)
	_ = g.AddEdge(3, 5)

	file, _ := os.Create("./simple.gv")
	_ = draw.DOT(g, file)
}
It has been rendered using the neato engine:
dot -Tsvg -Kneato -O simple.gv
The example uses the Brewer color scheme supported by Graphviz.
Edges may have one or more attributes which can be used to store metadata. Attributes will be taken into account when visualizing a graph. For example, this edge will be rendered in red color:
_ = g.AddEdge(1, 2, graph.EdgeAttribute("color", "red"))
To get an overview of all supported attributes, take a look at the DOT documentation.
The stored attributes can be retrieved by getting the edge and accessing the Properties.Attributes
field.
edge, _ := g.Edge(1, 2)
color := edge.Properties.Attributes["color"]
It is also possible to store arbitrary data inside edges, not just key-value string pairs. This data
is of type any.
_ = g.AddEdge(1, 2, graph.EdgeData(myData))
The stored data can be retrieved by getting the edge and accessing the Properties.Data field.
edge, _ := g.Edge(1, 2)
myData := edge.Properties.Data
Edge properties can be updated using Graph.UpdateEdge. The following example adds a new color
attribute to the edge (A,B) and sets the edge weight to 10.
_ = g.UpdateEdge("A", "B", graph.EdgeAttribute("color", "red"), graph.EdgeWeight(10))
The method signature and the accepted functional options are exactly the same as for Graph.AddEdge.
Vertices may have one or more attributes which can be used to store metadata. Attributes will be taken into account when visualizing a graph. For example, this vertex will be rendered in red color:
_ = g.AddVertex(1, graph.VertexAttribute("style", "filled"))
The stored data can be retrieved by getting the vertex using VertexWithProperties and accessing
the Attributes field.
vertex, properties, _ := g.VertexWithProperties(1)
style := properties.Attributes["style"]
To get an overview of all supported attributes, take a look at the DOT documentation.
You can integrate any storage backend by implementing the Store interface and initializing a new
graph with it:
g := graph.NewWithStore(graph.IntHash, myStore)
To implement the Store interface appropriately, take a look at the documentation.
graph-sql is a ready-to-use SQL store implementation.
The full documentation is available at pkg.go.dev.
Are you using graph? Check out the graph user survey.
FAQs
Unknown package
Did you know?

Socket for GitHub automatically highlights issues in each pull request and monitors the health of all your open source dependencies. Discover the contents of your packages and block harmful activity before you install or update your dependencies.

Security News
The MCP Steering Committee has launched the official MCP Registry in preview, a central hub for discovering and publishing MCP servers.

Product
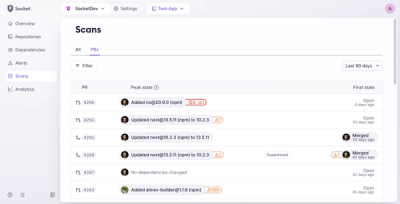
Socket’s new Pull Request Stories give security teams clear visibility into dependency risks and outcomes across scanned pull requests.

Research
/Security News
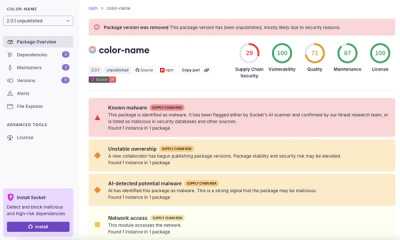
npm author Qix’s account was compromised, with malicious versions of popular packages like chalk-template, color-convert, and strip-ansi published.