Product
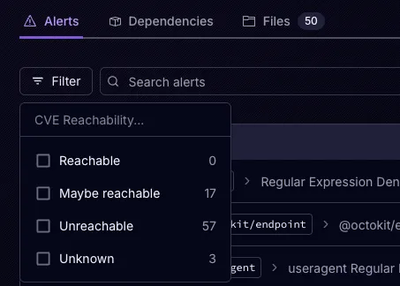
Announcing Precomputed Reachability Analysis in Socket
Socket’s precomputed reachability slashes false positives by flagging up to 80% of vulnerabilities as irrelevant, with no setup and instant results.
By Martin Torp - Jul 30, 2025
github.com/goplugin/plugin-testing-framework/wasp

![]()
![]()
![]()
Scalable protocol-agnostic load testing library for Go
Go codego testk8s without complicated configuration or vendored UI interfacesLokiWe are using nix for deps, see installation guide
nix develop
make start
Insert GRAFANA_TOKEN created in previous command
export LOKI_TOKEN=
export LOKI_URL=http://localhost:3030/loki/api/v1/push
export GRAFANA_URL=http://localhost:3000
export GRAFANA_TOKEN=
export DATA_SOURCE_NAME=Loki
export DASHBOARD_FOLDER=LoadTests
export DASHBOARD_NAME=Wasp

make dashboard
Run some tests:
make test_loki
Open your Grafana dashboard
In case you deploy to your own Grafana check DASHBOARD_FOLDER and DASHBOARD_NAME, defaults are LoadTests dir and dashboard is called Wasp
Remove environment:
make stop
Check examples to understand what is the easiest way to structure your tests, run them both locally and remotely, at scale, inside k8s
make pyro_start
make test_pyro_rps
make test_pyro_vu
make pyro_stop
Open pyroscope
You can also use trace.out in the root folder with Go default tracing UI

Check this doc for more examples and project overview
You can check all the messages the tool sends with env var WASP_LOG_LEVEL=trace
If Loki client fail to deliver a batch test will proceed, if you experience Loki issues, consider setting Timeout in LokiConfig or set MaxErrors: 10 to return an error after N Loki errors
MaxErrors: -1 can be used to ignore all the errors
Default Promtail settings are:
&LokiConfig{
    TenantID:                os.Getenv("LOKI_TENANT_ID"),
    URL:                     os.Getenv("LOKI_URL"),
    Token:                   os.Getenv("LOKI_TOKEN"),
    BasicAuth:               os.Getenv("LOKI_BASIC_AUTH"),
    MaxErrors:               10,
    BatchWait:               5 * time.Second,
    BatchSize:               500 * 1024,
    Timeout:                 20 * time.Second,
    DropRateLimitedBatches:  false,
    ExposePrometheusMetrics: false,
    MaxStreams:              600,
    MaxLineSize:             999999,
    MaxLineSizeTruncate:     false,
}
If you see errors like
ERR Malformed promtail log message, skipping Line=["level",{},"component","client","host","...","msg","batch add err","tenant","","error",{}]
Try to increase MaxStreams even more or check your Loki configuration
Basic dashboard:

You can integrate components from the WASP dashboard into your custom dashboards.
Example:
import (
    waspdashboard "github.com/goplugin/wasp/dashboard"
)

func BuildCustomLoadTestDashboard(dashboardName string) (dashboard.Builder, error) {
    // Custom key,value used to query for panels
    panelQuery := map[string]string{
		"branch": `=~"${branch:pipe}"`,
		"commit": `=~"${commit:pipe}"`,
        "network_type": `="testnet"`,
	}

	return dashboard.New(
		dashboardName,
        waspdashboard.WASPLoadStatsRow("Loki", panelQuery),
		waspdashboard.WASPDebugDataRow("Loki", panelQuery, true),
        # other options
    )
}
To enable dashboard annotations and alert monitoring, utilize the WithGrafana() function in conjunction with wasp.Profile. This approach allows for the integration of dashboard annotations and the evaluation of dashboard alerts.
Example:
_, err = wasp.NewProfile().
    WithGrafana(grafanaOpts).
    Add(wasp.NewGenerator(getLatestReportByTimestampCfg)).
    Run(true)
require.NoError(t, err)
Where:
type GrafanaOpts struct {
	GrafanaURL                   string        `toml:"grafana_url"`
	GrafanaToken                 string        `toml:"grafana_token_secret"`
	WaitBeforeAlertCheck         time.Duration `toml:"grafana_wait_before_alert_check"`                  // Cooldown period to wait before checking for alerts
	AnnotateDashboardUIDs        []string      `toml:"grafana_annotate_dashboard_uids"`                  // Grafana dashboardUIDs to annotate start and end of the run
	CheckDashboardAlertsAfterRun []string      `toml:"grafana_check_alerts_after_run_on_dashboard_uids"` // Grafana dashboardIds to check for alerts after run
}
FAQs
Unknown package
Did you know?

Socket for GitHub automatically highlights issues in each pull request and monitors the health of all your open source dependencies. Discover the contents of your packages and block harmful activity before you install or update your dependencies.
Product
Socket’s precomputed reachability slashes false positives by flagging up to 80% of vulnerabilities as irrelevant, with no setup and instant results.
Product
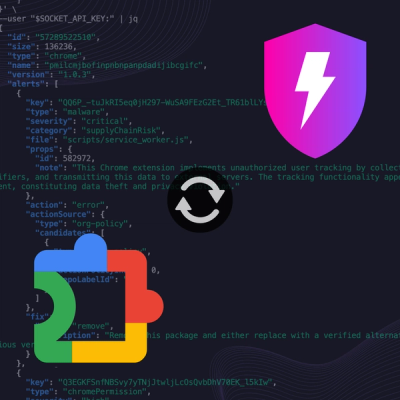
Socket is launching experimental protection for Chrome extensions, scanning for malware and risky permissions to prevent silent supply chain attacks.

Product
Add secure dependency scanning to Claude Desktop with Socket MCP, a one-click extension that keeps your coding conversations safe from malicious packages.