Product
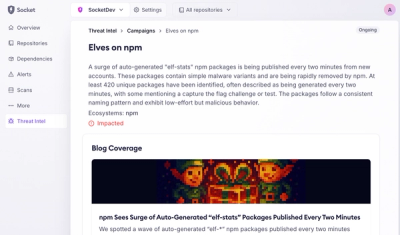
Introducing Supply Chain Attack Campaigns Tracking in the Socket Dashboard
Campaign-level threat intelligence in Socket now shows when active supply chain attacks affect your repositories and packages.
promplot is an opinionated tool to create plots from your Prometheus metrics and automatically sends them to you.
Slack example:
promplot -title "Open File Descriptors" -query "process_open_fds" -range "7d" -url $promurl -slack $slacktoken -channel stats

Currently the only implemented transport is Slack. But feel free to add a new one!
Usage: promplot [flags...]

Create and deliver plots from your Prometheus metrics.

Save plot to file or send it right to a slack channel.
One of -slack or -file must be set.


Flags:
  -channel string
        Required when -slack is set. Slack channel to post to.
  -file string
        File to save image to. Should have same extension as specified -format. Set -file to - to write to stdout.
  -format string
        Optional. Image format. For possible values see: https://godoc.org/github.com/gonum/plot/vg/draw#NewFormattedCanvas (default "png")
  -query string
        Required. PQL query.
  -range value
        Required. Time to look back to. Format: 5d12h34m56s
  -silent
        Optional. Suppress all output.
  -slack string
        Slack API token (https://api.slack.com/docs/oauth-test-tokens). Set to post plot to Slack.
  -time value
        Time for query (default is now). Format like the default format of the Unix date command.
  -title string
        Optional. Title of graph. (default "Prometheus metrics")
  -url string
        Required. URL of Prometheus server.
  -version
        Print binary version.
go get qvl.io/promplot
brew install qvl/tap/promplot
It's simple to create a shell script for multiple plots:
common="-url $promurl -channel stats -slack $slacktoken -range 24h"

promplot $common \
  -title "Free memory in MB" \
  -query "node_memory_MemFree /1024 /1024"

promplot $common \
  -title "Free disk space in GB" \
  -query "node_filesystem_free /1024 /1024 /1024"

promplot $common \
  -title "Open file descriptors" \
  -query "process_open_fds"
There is no mail transport built into promplot but you can use the Linux mail utility instead:
tmp="$(mktemp -d)"
common="-url $promurl -range 24h"

promplot $common \
  -title "Free memory in MB" \
  -query "node_memory_MemFree /1024 /1024" \
  -file ${tmp}/memory.png

promplot $common \
  -title "Open file descriptors" \
  -query "process_open_fds" \
  -file ${tmp}/fds.png

echo "Your daily report is here." | mail \
  -s "Daily server stats" \
  -a ${tmp}/memory.png \
  -a ${tmp}/fds.png \
  name@example.com
And with a scheduler like sleepto you can easily automate this script to run every day or once a week.
Make sure to use gofmt and create a Pull Request.
When changing external dependencies please use dep to vendor them.
Push a new Git tag and GoReleaser will automatically create a release.
to these helpful open source projects promplot is built on top of:
FAQs
Unknown package
Did you know?

Socket for GitHub automatically highlights issues in each pull request and monitors the health of all your open source dependencies. Discover the contents of your packages and block harmful activity before you install or update your dependencies.

Product
Campaign-level threat intelligence in Socket now shows when active supply chain attacks affect your repositories and packages.

Research
Malicious PyPI package sympy-dev targets SymPy users, a Python symbolic math library with 85 million monthly downloads.

Security News
Node.js 25.4.0 makes require(esm) stable, formalizing CommonJS and ESM compatibility across supported Node versions.