
Research
Security News
The Growing Risk of Malicious Browser Extensions
Socket researchers uncover how browser extensions in trusted stores are used to hijack sessions, redirect traffic, and manipulate user behavior.
By Kush Pandya - Jun 13, 2025
@adobe/react-spectrum-charts
Advanced tools
Declarative library for composing Spectrum visualizations in React.


React Spectrum Charts documentation
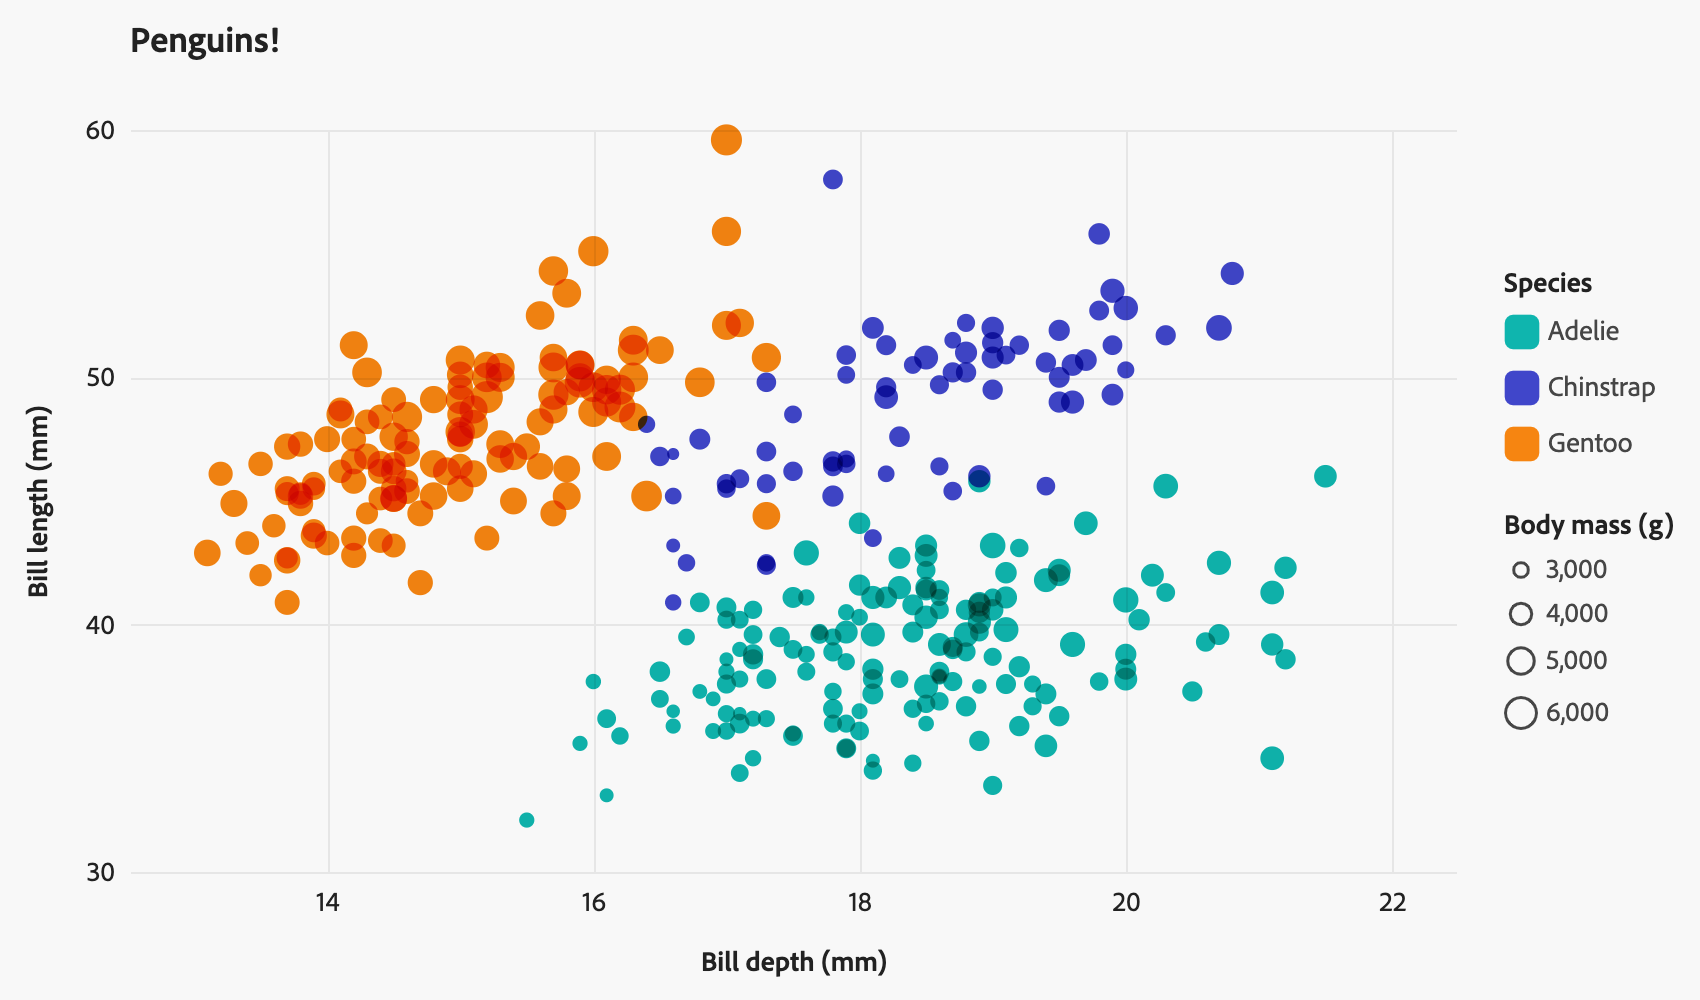
react-spectrum-charts is a declarative charting library for composing charts in React. It empowers you to effortlessly create visually stunning charts following Adobe's design system (Spectrum) with minimal code. Understanding of the grammar of graphics or lower-level libraries like D3 or Vega is not needed.
Intuitive: Developer experience comes first in the API design. The declarative API removes the need to understand advanced data visualization concepts. The code reads just like you would explain the chart to someone else.
Configurable: The component-based building blocks enable you to build the chart that solves your use case. The modular design makes it easy to compose complex visualizations with simple, easy to understand code.
Proven: By leveraging Spectrum (Adobe's Spectrum design system) you get beautiful charts backed by research, user testing, and industry best practices.
International: Support for 30+ date/number locales so that your users can view their data in the format that they would expect.
npm install @adobe/react-spectrum-charts @adobe/react-spectrum vega vega-lite
yarn add @adobe/react-spectrum-charts @adobe/react-spectrum vega vega-lite
react-spectrum-charts is designed in a way that makes composing charts similar to composing any other app content in JSX.
Each chart is wrapped in the <Chart/> component. The child components and their props control the contents of the chart.
import React from 'react';
import {Axis, Bar, Legend, Chart} from '@adobe/react-spectrum-charts';

const MyChart: FC<MyChartProps> = (props) => {
    ...

    return (
        <Chart data={myChartData}>
            <Axis position="bottom" />
            <Axis position="left" />
            <Bar type="stacked" color="series" />
            <Legend />
        </Chart>
    )
}
Adobe's design system has detailed guidelines for charting fundamentals, color selection for charts as well as design guidelines for the primary chart components.
react-spectrum-charts is the react implementation of these guidelines.
This library has an extensive Storybook with stories for every component and most props. You can use the controls tab in storybook to alter component props and see how that alters the chart in real time.
It is also possible to view the source code for any story by selecting the "Docs" tab, scrolling to the desired story and then selecting "Show code". This is helpful for seeing the full API for any story in storybook.
The Storybook may contain components or props that are not released yet since it gets rebuilt with every push to main, not just with npm releases.
If you encounter any issues, have questions, or need assistance with react-spectrum-charts, there are several ways to get support:
Documentation: Check out the official documentation for examples, API documentation and developer docs.
GitHub Issues: If you believe you've identified a bug or have a feature request or have general feedback, please review the list of open issues to see if someone else has already submitted a similar issue that you can add to. If an issue doesn't exist, please submit a new issue using the correct template (create a new issue).
Please be respectful and considerate when seeking support. Provide as much context as possible when reporting issues, and follow any guidelines or templates specified in the GitHub issues section. Your feedback and contributions are highly valued.
react-spectrum-charts is open-source software released under the Apache License 2.0. You can find a copy of the license in the LICENSE file included with the project.
Permissions: You are granted broad permissions to use, modify, distribute, and sublicense the software. You can use it for commercial purposes.
Conditions: You must include the original copyright notice and disclaimers. You cannot use trademarks of the project without proper attribution.
Limitations: The license is not a warranty, and the software is provided "as is." The project's contributors are not liable for any damages.
More Information: For a full and detailed explanation of the Apache License 2.0, please refer to the official license document.
By using react-spectrum-charts, you agree to comply with the terms and conditions of the Apache License 2.0.
Please review the LICENSE file for the complete text of the license.
The roadmap for this project is tracked in github projects. You must be a member of the Adobe org to see the roadmap.
FAQs
Declarative library for composing Spectrum visualizations in React.
The npm package @adobe/react-spectrum-charts receives a total of 82 weekly downloads. As such, @adobe/react-spectrum-charts popularity was classified as not popular.
We found that @adobe/react-spectrum-charts demonstrated a healthy version release cadence and project activity because the last version was released less than a year ago. It has 30 open source maintainers collaborating on the project.
Did you know?

Socket for GitHub automatically highlights issues in each pull request and monitors the health of all your open source dependencies. Discover the contents of your packages and block harmful activity before you install or update your dependencies.
Research
Security News
Socket researchers uncover how browser extensions in trusted stores are used to hijack sessions, redirect traffic, and manipulate user behavior.

Research
Security News
An in-depth analysis of credential stealers, crypto drainers, cryptojackers, and clipboard hijackers abusing open source package registries to compromise Web3 development environments.

Security News
pnpm 10.12.1 introduces a global virtual store for faster installs and new options for managing dependencies with version catalogs.