Product
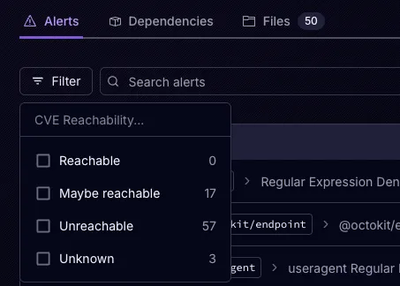
Announcing Precomputed Reachability Analysis in Socket
Socket’s precomputed reachability slashes false positives by flagging up to 80% of vulnerabilities as irrelevant, with no setup and instant results.
By Martin Torp - Jul 30, 2025
@antv/g2
Advanced tools
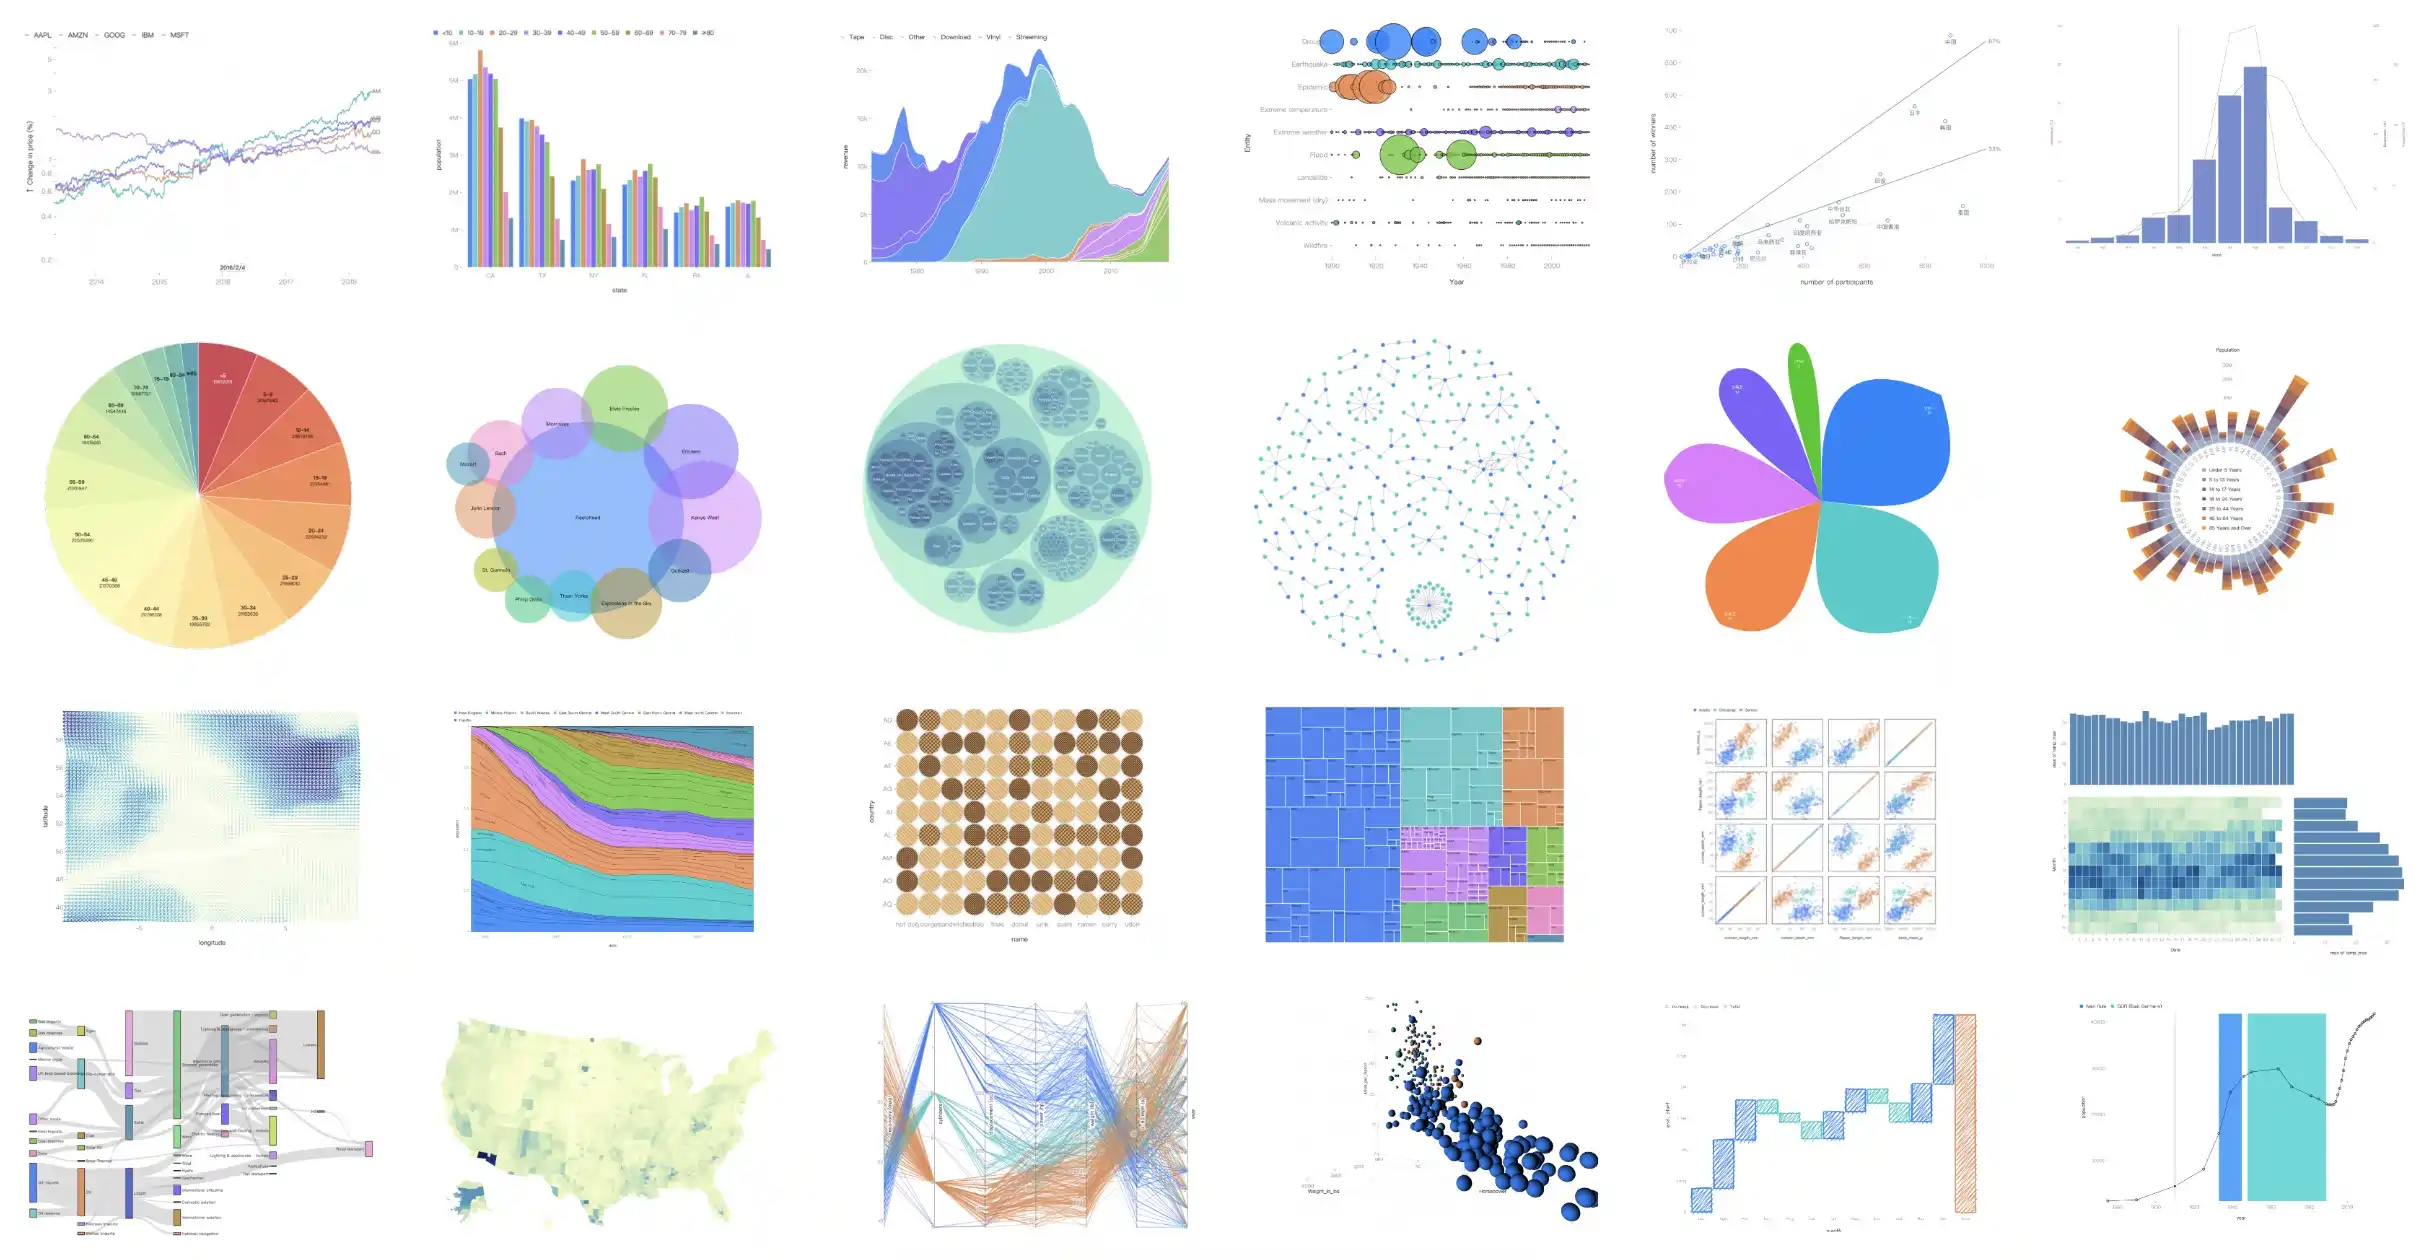
@antv/g2 is a powerful and flexible data visualization library for creating a wide range of charts and graphs. It is designed to be highly customizable and supports a variety of chart types, including bar charts, line charts, pie charts, and more. The library is built on top of the AntV visualization ecosystem and provides a declarative syntax for defining visualizations.
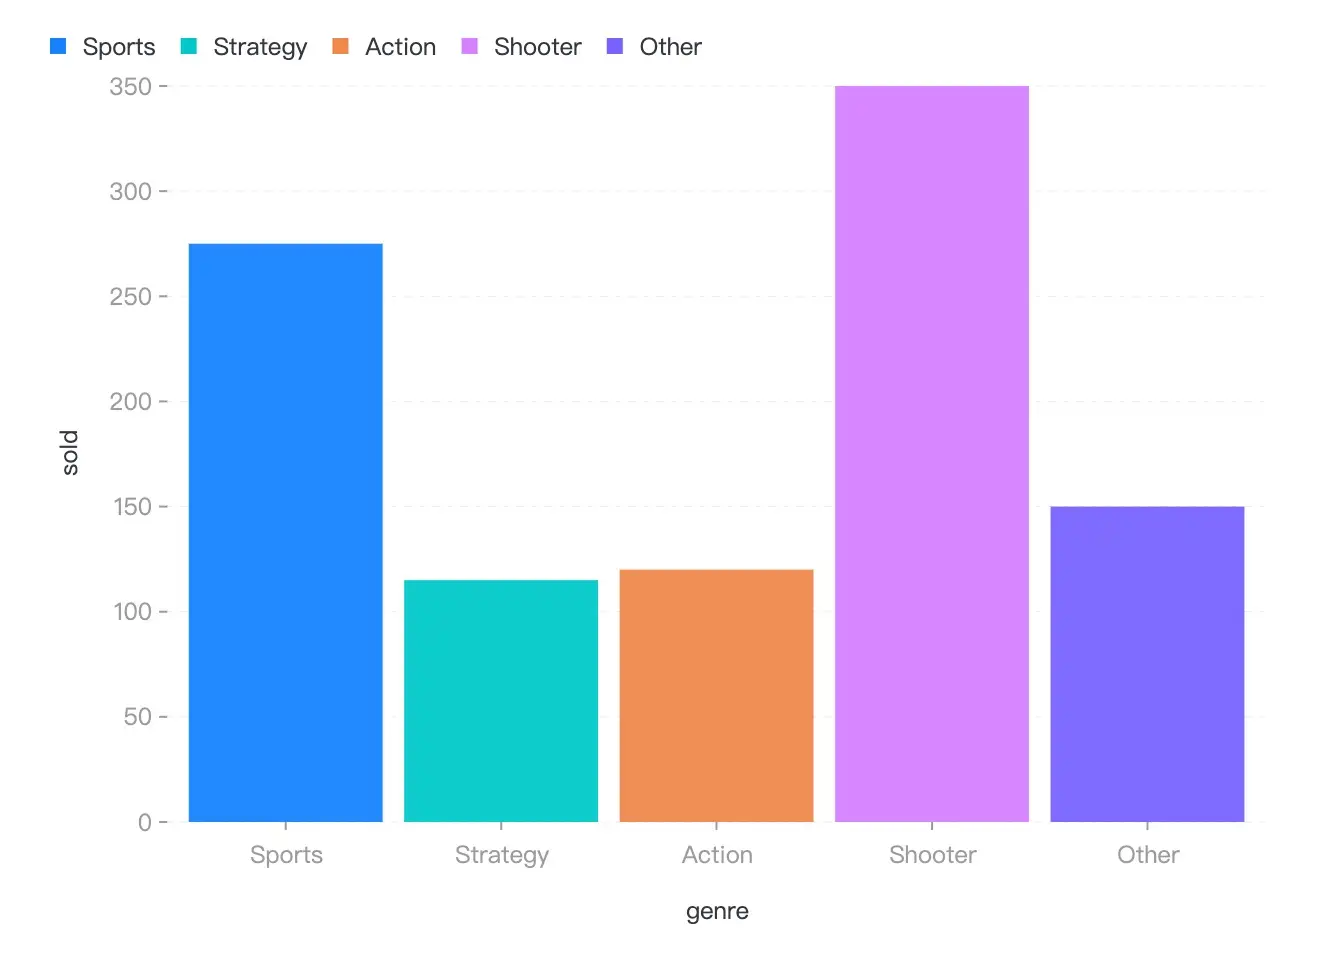
Bar Chart
This code creates a simple bar chart using the @antv/g2 library. It defines a dataset and uses the `interval` geometry to create bars representing the data.
const { Chart } = require('@antv/g2');
const data = [
{ genre: 'Sports', sold: 275 },
{ genre: 'Strategy', sold: 115 },
{ genre: 'Action', sold: 120 },
{ genre: 'Shooter', sold: 350 },
{ genre: 'Other', sold: 150 }
];
const chart = new Chart({ container: 'container', autoFit: true, height: 500 });
chart.data(data);
chart.interval().position('genre*sold');
chart.render();Line Chart
This code creates a line chart using the @antv/g2 library. It defines a dataset and uses the `line` geometry to create a line representing the data over time.
const { Chart } = require('@antv/g2');
const data = [
  { year: '1991', value: 3 },
  { year: '1992', value: 4 },
  { year: '1993', value: 3.5 },
  { year: '1994', value: 5 },
  { year: '1995', value: 4.9 },
  { year: '1996', value: 6 },
  { year: '1997', value: 7 },
  { year: '1998', value: 9 },
  { year: '1999', value: 13 }
];
const chart = new Chart({ container: 'container', autoFit: true, height: 500 });
chart.data(data);
chart.scale({ year: { range: [0, 1] }, value: { min: 0 } });
chart.line().position('year*value');
chart.render();
Pie Chart
This code creates a pie chart using the @antv/g2 library. It defines a dataset and uses the `interval` geometry with a `theta` coordinate to create slices representing the data.
const { Chart } = require('@antv/g2');
const data = [
  { item: 'A', count: 40 },
  { item: 'B', count: 21 },
  { item: 'C', count: 17 },
  { item: 'D', count: 13 },
  { item: 'E', count: 9 }
];
const chart = new Chart({ container: 'container', autoFit: true, height: 500 });
chart.data(data);
chart.coordinate('theta', { radius: 0.75 });
chart.interval().position('count').color('item').adjust('stack');
chart.render();Chart.js is a popular open-source library for creating simple yet flexible charts. It supports a variety of chart types, including bar, line, and pie charts. Compared to @antv/g2, Chart.js is easier to get started with but may lack some of the advanced customization options.
D3.js is a powerful library for creating complex and highly customizable data visualizations. It provides low-level building blocks for creating a wide range of visualizations. Compared to @antv/g2, D3.js offers more control and flexibility but has a steeper learning curve.
Highcharts is a commercial charting library that offers a wide range of chart types and extensive customization options. It is known for its high-quality visualizations and ease of use. Compared to @antv/g2, Highcharts provides more out-of-the-box features but requires a license for commercial use.
 English | 简体中文
G2 is a visualization grammar for dashboard building, data exploration and storytelling.
![]()


G2 is named after Leland Wilkinson’s book The Grammar of Graphics and was profoundly inspired by it in the very beginning. Here are some resources you can begin with:
G2 is usually installed via a package manager such as npm or Yarn.
$ npm install @antv/g2
$ yarn add @antv/g2
The Chart object then can be imported from G2.
<div id="container"></div>
import { Chart } from '@antv/g2';

// A tabular data to be visualized.
const data = [
  { genre: 'Sports', sold: 275 },
  { genre: 'Strategy', sold: 115 },
  { genre: 'Action', sold: 120 },
  { genre: 'Shooter', sold: 350 },
  { genre: 'Other', sold: 150 },
];

// Instantiate a new chart.
const chart = new Chart({
  container: 'container',
});

// Specify visualization.
chart
  .interval() // Create an interval mark and add it to the chart.
  .data(data) // Bind data for this mark.
  .encode('x', 'genre') // Assign genre column to x position channel.
  .encode('y', 'sold') // Assign sold column to y position channel.
  .encode('color', 'genre'); // Assign genre column to color channel.

// Render visualization.
chart.render();
If all goes well, you can get the following lovely bar chart!
This project exists thanks to all the people who contribute.
And thank you to all our backers! 🙏

MIT@AntV.
5.3.5 (2025-07-21)
FAQs
the Grammar of Graphics in Javascript
The npm package @antv/g2 receives a total of 108,545 weekly downloads. As such, @antv/g2 popularity was classified as popular.
We found that @antv/g2 demonstrated a healthy version release cadence and project activity because the last version was released less than a year ago. It has 74 open source maintainers collaborating on the project.
Did you know?

Socket for GitHub automatically highlights issues in each pull request and monitors the health of all your open source dependencies. Discover the contents of your packages and block harmful activity before you install or update your dependencies.
Product
Socket’s precomputed reachability slashes false positives by flagging up to 80% of vulnerabilities as irrelevant, with no setup and instant results.
Product
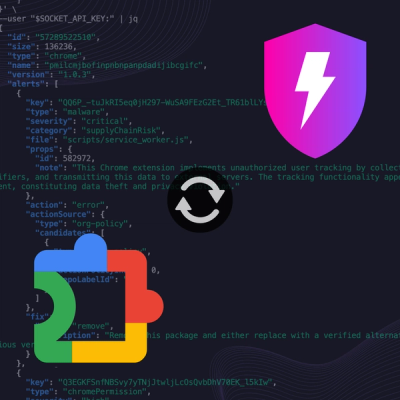
Socket is launching experimental protection for Chrome extensions, scanning for malware and risky permissions to prevent silent supply chain attacks.

Product
Add secure dependency scanning to Claude Desktop with Socket MCP, a one-click extension that keeps your coding conversations safe from malicious packages.