Product
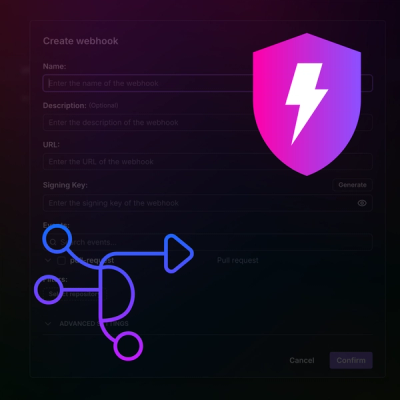
Introducing Webhook Events for Pull Request Scans
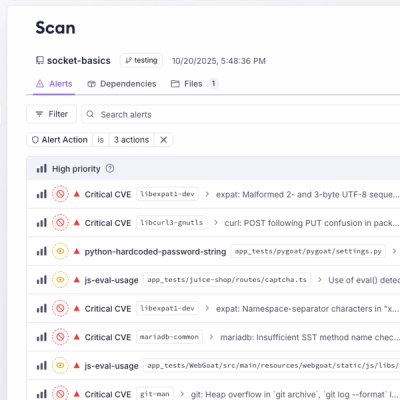
Add real-time Socket webhook events to your workflows to automatically receive pull request scan results and security alerts in real time.
By Jeppe Hasseriis - Oct 22, 2025
@arcmantle/esplot
Advanced tools
Experimental data visualization library with TypeScript API and native desktop viewer
⚠️ Experimental - This project is experimental and not feature complete, but the base functionality works.
ESPlot is a data visualization library that combines TypeScript/Node.js chart creation with a native desktop viewer. It allows you to programmatically generate charts using a simple API and display them in a dedicated viewer application.
This package is part of the Weave monorepo and can be built using the centralized build system from the project root.
ESPlot consists of two main components:
The workflow is:
barChart()The easiest way to use ESPlot is to add it as a dependency to your project. The pre-built viewer binaries are included in the package:
npm install @arcmantle/esplot
# or with pnpm
pnpm add @arcmantle/esplot
# or with yarn
yarn add @arcmantle/esplot
Then you can directly start creating charts:
import { barChart } from '@arcmantle/esplot';

await barChart(
  { year: 2020, count: 10 },
  { year: 2021, count: 20 },
  { year: 2022, count: 15 }
);
If you want to build from source or contribute to the project:
ESPlot is part of a larger monorepo. You can build it from the project root:
# From the monorepo root, build the ESPlot package
pnpm build-package @arcmantle/esplot

# Or build all packages
pnpm build
If you need to build components separately:
# Navigate to the ESPlot package directory
cd packages/core/esplot

# Build the TypeScript library and viewer binaries
pnpm build

# Or build components individually:
pnpm build-ts                    # TypeScript library only
pnpm build-viewer-windows        # Windows viewer binary
pnpm build-viewer-macos          # macOS viewer binary
# Make sure the package is built first
pnpm build

# Run the demo
node demo/index.ts
import { barChart } from '@arcmantle/esplot';

// Create a bar chart
await barChart(
  { year: 2020, count: 10 },
  { year: 2021, count: 20 },
  { year: 2022, count: 15 }
);
The chart will automatically open in the ESPlot viewer window.
FAQs
Experimental data visualization library with TypeScript API and native desktop viewer
We found that @arcmantle/esplot demonstrated a healthy version release cadence and project activity because the last version was released less than a year ago. It has 1 open source maintainer collaborating on the project.
Did you know?

Socket for GitHub automatically highlights issues in each pull request and monitors the health of all your open source dependencies. Discover the contents of your packages and block harmful activity before you install or update your dependencies.
Product
Add real-time Socket webhook events to your workflows to automatically receive pull request scan results and security alerts in real time.

Research
The Socket Threat Research Team uncovered malicious NuGet packages typosquatting the popular Nethereum project to steal wallet keys.
Product
A single platform for static analysis, secrets detection, container scanning, and CVE checks—built on trusted open source tools, ready to run out of the box.