Product
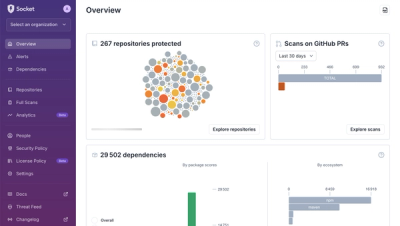
A New Overview in our Dashboard
We redesigned Socket's first logged-in page to display rich and insightful visualizations about your repositories protected against supply chain threats.
By André Staltz - Apr 29, 2025
@awey/react-chart-container
Advanced tools
A chart container component that can be used to wrap various charts. It will handle 'init ', 'update', and 'resize' of chart appropriatly.
React Chart Container is a React component that can wrap chart elements and handle it's init, update and resize event properly.
If you render a chart on an element like div with some library like ECharts, you'll have to consider all the concepts bellow:
it's really annoying to do all the things.
React Chart Container can help you with all the stuff above.
React Chart Container can be installed by npm or yarn.
# yarn
yarn add @awey/react-chart-container

# npm
npm install @awey/react-chart-container
And you should import the component, style and hook.
import { ReactChartContainer, useReactChartContainer } from '@awey/react-chart-container'
import '@awey/react-chart-container/lib/style.css'
A typical example is as bellow:
import { FC, useEffect, useState } from 'react'
import * as echarts from 'echarts/core'
import { LineChart } from 'echarts/charts'
import { CanvasRenderer } from 'echarts/renderers'
import { GridComponent } from 'echarts/components'
import { TimelineData, getMockData } from './mock-data'
import { ReactChartContainer, useReactChartContainer } from '../react-chart-container'
import k from './k'

echarts.use([LineChart, CanvasRenderer, GridComponent])

const Spin: FC = () => <div>Loading...</div>

function transformData (data: TimelineData) {
  return data.values.map(line => {
    return {
      type: 'line',
      name: line.name,
      id: line.alias + ':::' + line.name,
      data: line.data.map((point, index) => {
        if (!data.timestamps[index]) return null
        return {
          name: data.timestamps[index],
          value: [data.timestamps[index], point]
        }
      })
    }
  })
}

function App () {
  const [mockData, setMockData] = useState(getMockData())

  const { elRef, onReady, onResize, onDestroy } = useReactChartContainer<echarts.ECharts, TimelineData, string>({
    init: (el, d) => {
      // console.log('settings in init function:', s)
      const instance = echarts.init(el)

      instance.setOption({
        xAxis: {
          type: 'time'
        },
        yAxis: {
          type: 'value',
          axisLabel: { formatter: (v: number) => k(v) }
        },
        grid: {
          show: true,
          left: 56,
          bottom: 24,
          right: 8,
          top: 28
        },
        series: transformData(d)
      }, { lazyUpdate: true })

      return instance
    },
    resize: (graph, size) => graph.resize(),
    update: (graph, d) => {
      graph.setOption({
        series: transformData(d)
      }, { lazyUpdate: true, replaceMerge: 'series' })
    },
    destroy: graph => graph.dispose()
  }, mockData as TimelineData, 'hello')

  useEffect(() => {
    window.setInterval(() => {
      setMockData(getMockData())
    }, 3000)
  }, [])

  return (
    <div >
      <ReactChartContainer
        onReady={onReady}
        onResize={onResize}
        onDestroy={onDestroy}
        spinIcon={<Spin />}
        loading={false}>
        <div ref={elRef} style={{ height: 400 }}></div>
      </ReactChartContainer>
    </div>
  )
}

export default App
ReactChartContainer| prop | type | required/default | description |
|---|---|---|---|
onReady | () => void | - | the callback of container ready |
onResize | (size: Rect) => void | - | the callback of container resizing |
onDestroy | () => void | - | the callback of container destroy |
loading | boolean | false | indecate loading status |
className | string | '' | class name |
useReactChartContainerconst useReactChartContainer: <
GraphType,
Data,
Settings = undefined
>(
chart: Chart<GraphType, Data, Settings>,
data: Data,
settings: Settings
) => {
elRef: MutableRefObject<null>
graphRef: GraphRef<GraphType>
onReady: () => void
onResize: (size: Rect) => void
onDestroy: () => void
}
interface Chart<GraphType, Data> {
init (element: HTMLDivElement, data: Data): GraphType
resize (graph: GraphType, data: Data): void
update (graph: GraphType, data: Data): void
destroy (graph: GraphType): void
}
export type GraphRef<GraphType> = MutableRefObject<GraphType | null>
FAQs
A chart container component that can be used to wrap various charts. It will handle 'init ', 'update', and 'resize' of chart appropriatly.
We found that @awey/react-chart-container demonstrated a healthy version release cadence and project activity because the last version was released less than a year ago. It has 0 open source maintainers collaborating on the project.
Did you know?

Socket for GitHub automatically highlights issues in each pull request and monitors the health of all your open source dependencies. Discover the contents of your packages and block harmful activity before you install or update your dependencies.
Product
We redesigned Socket's first logged-in page to display rich and insightful visualizations about your repositories protected against supply chain threats.
Product
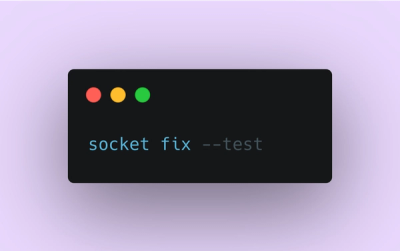
Automatically fix and test dependency updates with socket fix—a new CLI tool that turns CVE alerts into safe, automated upgrades.

Security News
CISA denies CVE funding issues amid backlash over a new CVE foundation formed by board members, raising concerns about transparency and program governance.