Product
Introducing Enhanced Alert Actions and Triage Functionality
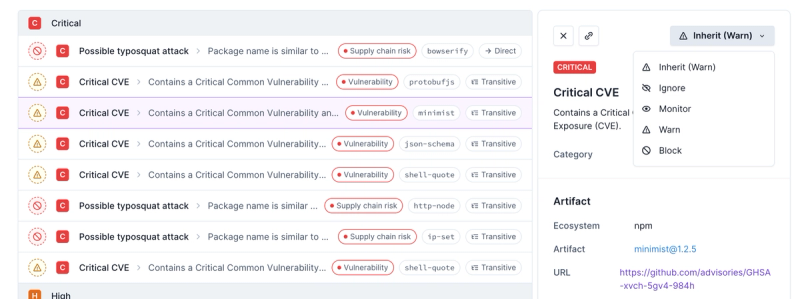
Socket now supports four distinct alert actions instead of the previous two, and alert triaging allows users to override the actions taken for all individual alerts.
@aws-cdk/aws-cloudwatch
Advanced tools
Changelog
1.72.0 (2020-11-06)
enableHttpEndpoint renamed to enableDataApioutputLocation in the experimental Athena StartQueryExecution has been changed to s3.Location from stringEnvironment from attributes (#10932) (d395b5e), closes #10931--no-previous-parameters incorrectly skips updates (#11288) (1bfc649)Readme
Metric objects represent a metric that is emitted by AWS services or your own
application, such as CPUUsage, FailureCount or Bandwidth.
Metric objects can be constructed directly or are exposed by resources as
attributes. Resources that expose metrics will have functions that look
like metricXxx() which will return a Metric object, initialized with defaults
that make sense.
For example, lambda.Function objects have the fn.metricErrors() method, which
represents the amount of errors reported by that Lambda function:
const errors = fn.metricErrors();
You can also instantiate Metric objects to reference any
published metric
that's not exposed using a convenience method on the CDK construct.
For example:
const hostedZone = new route53.HostedZone(this, 'MyHostedZone', { zoneName: "example.org" });
const metric = new Metric({
  namespace: 'AWS/Route53',
  metricName: 'DNSQueries',
  dimensions: {
    HostedZoneId: hostedZone.hostedZoneId
  }
})
If you want to reference a metric that is not yet exposed by an existing construct,
you can instantiate a Metric object to represent it. For example:
const metric = new Metric({
  namespace: 'MyNamespace',
  metricName: 'MyMetric',
  dimensions: {
    ProcessingStep: 'Download'
  }
});
Math expressions are supported by instantiating the MathExpression class.
For example, a math expression that sums two other metrics looks like this:
const allProblems = new MathExpression({
  expression: "errors + faults",
  usingMetrics: {
    errors: myConstruct.metricErrors(),
    faults: myConstruct.metricFaults(),
  }
})
You can use MathExpression objects like any other metric, including using
them in other math expressions:
const problemPercentage = new MathExpression({
  expression: "(problems / invocations) * 100",
  usingMetrics: {
    problems: allProblems,
    invocations: myConstruct.metricInvocations()
  }
})
To graph or alarm on metrics you must aggregate them first, using a function
like Average or a percentile function like P99. By default, most Metric objects
returned by CDK libraries will be configured as Average over 300 seconds (5 minutes).
The exception is if the metric represents a count of discrete events, such as
failures. In that case, the Metric object will be configured as Sum over 300 seconds, i.e. it represents the number of times that event occurred over the
time period.
If you want to change the default aggregation of the Metric object (for example, the function or the period), you can do so by passing additional parameters to the metric function call:
const minuteErrorRate = fn.metricErrors({
  statistic: 'avg',
  period: Duration.minutes(1),
  label: 'Lambda failure rate'
});
This function also allows changing the metric label or color (which will be useful when embedding them in graphs, see below).
Rates versus Sums
The reason for using
Sumto count discrete events is that some events are emitted as either0or1(for exampleErrorsfor a Lambda) and some are only emitted as1(for exampleNumberOfMessagesPublishedfor an SNS topic).In case
0-metrics are emitted, it makes sense to take theAverageof this metric: the result will be the fraction of errors over all executions.If
0-metrics are not emitted, theAveragewill always be equal to1, and not be very useful.In order to simplify the mental model of
Metricobjects, we default to aggregating usingSum, which will be the same for both metrics types. If you happen to know the Metric you want to alarm on makes sense as a rate (Average) you can always choose to change the statistic.
Alarms can be created on metrics in one of two ways. Either create an Alarm
object, passing the Metric object to set the alarm on:
new Alarm(this, 'Alarm', {
  metric: fn.metricErrors(),
  threshold: 100,
  evaluationPeriods: 2,
});
Alternatively, you can call metric.createAlarm():
fn.metricErrors().createAlarm(this, 'Alarm', {
  threshold: 100,
  evaluationPeriods: 2,
});
The most important properties to set while creating an Alarms are:
threshold: the value to compare the metric against.comparisonOperator: the comparison operation to use, defaults to metric >= threshold.evaluationPeriods: how many consecutive periods the metric has to be
breaching the the threshold for the alarm to trigger.To add actions to an alarm, use the integration classes from the
@aws-cdk/aws-cloudwatch-actions package. For example, to post a message to
an SNS topic when an alarm breaches, do the following:
import * as cw_actions from '@aws-cdk/aws-cloudwatch-actions';

// ...
const topic = new sns.Topic(stack, 'Topic');
const alarm = new cloudwatch.Alarm(stack, 'Alarm', { /* ... */ });

alarm.addAlarmAction(new cw_actions.SnsAction(topic));
Composite Alarms can be created from existing Alarm resources.
const alarmRule = AlarmRule.anyOf(
  AlarmRule.allOf(
    AlarmRule.anyOf(
      alarm1,
      AlarmRule.fromAlarm(alarm2, AlarmState.OK),
      alarm3,
    ),
    AlarmRule.not(AlarmRule.fromAlarm(alarm4, AlarmState.INSUFFICIENT_DATA)),
  ),
  AlarmRule.fromBoolean(false),
);

new CompositeAlarm(this, 'MyAwesomeCompositeAlarm', {
  alarmRule,
});
In CloudWatch, Metrics datums are emitted with units, such as seconds or
bytes. When Metric objects are given a unit attribute, it will be used to
filter the stream of metric datums for datums emitted using the same unit
attribute.
In particular, the unit field is not used to rescale datums or alarm threshold
values (for example, it cannot be used to specify an alarm threshold in
Megabytes if the metric stream is being emitted as bytes).
You almost certainly don't want to specify the unit property when creating
Metric objects (which will retrieve all datums regardless of their unit),
unless you have very specific requirements. Note that in any case, CloudWatch
only supports filtering by unit for Alarms, not in Dashboard graphs.
Please see the following GitHub issue for a discussion on real unit calculations in CDK: https://github.com/aws/aws-cdk/issues/5595
Dashboards are set of Widgets stored server-side which can be accessed quickly from the AWS console. Available widgets are graphs of a metric over time, the current value of a metric, or a static piece of Markdown which explains what the graphs mean.
The following widgets are available:
GraphWidget -- shows any number of metrics on both the left and right
vertical axes.AlarmWidget -- shows the graph and alarm line for a single alarm.SingleValueWidget -- shows the current value of a set of metrics.TextWidget -- shows some static Markdown.AlarmStatusWidget -- shows the status of your alarms in a grid view.A graph widget can display any number of metrics on either the left or
right vertical axis:
dashboard.addWidgets(new GraphWidget({
  title: "Executions vs error rate",

  left: [executionCountMetric],

  right: [errorCountMetric.with({
    statistic: "average",
    label: "Error rate",
    color: Color.GREEN
  })]
}));
Graph widgets can also display annotations attached to the left or the right y-axis.
dashboard.addWidgets(new GraphWidget({
  // ...
  // ...

  leftAnnotations: [
    { value: 1800, label: Duration.minutes(30).toHumanString(), color: Color.RED, },
    { value: 3600, label: '1 hour', color: '#2ca02c', }
  ],
}));
The graph legend can be adjusted from the default position at bottom of the widget.
dashboard.addWidgets(new GraphWidget({
  // ...
  // ...

  legendPosition: LegendPosition.RIGHT,
}));
The graph can publish live data within the last minute that has not been fully aggregated.
dashboard.addWidgets(new GraphWidget({
  // ...
  // ...

  liveData: true,
}));
An alarm widget shows the graph and the alarm line of a single alarm:
dashboard.addWidgets(new AlarmWidget({
  title: "Errors",
  alarm: errorAlarm,
}));
A single-value widget shows the latest value of a set of metrics (as opposed to a graph of the value over time):
dashboard.addWidgets(new SingleValueWidget({
  metrics: [visitorCount, purchaseCount],
}));
A text widget shows an arbitrary piece of MarkDown. Use this to add explanations to your dashboard:
dashboard.addWidgets(new TextWidget({
  markdown: '# Key Performance Indicators'
}));
An alarm status widget displays instantly the status of any type of alarms and gives the ability to aggregate one or more alarms together in a small surface.
dashboard.addWidgets(
  new AlarmStatusWidget({
    alarms: [errorAlarm],
  })
);
A LogQueryWidget shows the results of a query from Logs Insights:
dashboard.addWidgets(new LogQueryWidget({
  logGroupNames: ['my-log-group'],
  view: LogQueryVisualizationType.TABLE,
  // The lines will be automatically combined using '\n|'.
  queryLines: [
    'fields @message',
    'filter @message like /Error/',
  ]
}));
The widgets on a dashboard are visually laid out in a grid that is 24 columns wide. Normally you specify X and Y coordinates for the widgets on a Dashboard, but because this is inconvenient to do manually, the library contains a simple layout system to help you lay out your dashboards the way you want them to.
Widgets have a width and height property, and they will be automatically
laid out either horizontally or vertically stacked to fill out the available
space.
Widgets are added to a Dashboard by calling add(widget1, widget2, ...).
Widgets given in the same call will be laid out horizontally. Widgets given
in different calls will be laid out vertically. To make more complex layouts,
you can use the following widgets to pack widgets together in different ways:
Column: stack two or more widgets vertically.Row: lay out two or more widgets horizontally.Spacer: take up empty spaceFAQs
The CDK Construct Library for AWS::CloudWatch
The npm package @aws-cdk/aws-cloudwatch receives a total of 128,781 weekly downloads. As such, @aws-cdk/aws-cloudwatch popularity was classified as popular.
We found that @aws-cdk/aws-cloudwatch demonstrated a not healthy version release cadence and project activity because the last version was released a year ago. It has 4 open source maintainers collaborating on the project.
Did you know?

Socket for GitHub automatically highlights issues in each pull request and monitors the health of all your open source dependencies. Discover the contents of your packages and block harmful activity before you install or update your dependencies.

Product
Socket now supports four distinct alert actions instead of the previous two, and alert triaging allows users to override the actions taken for all individual alerts.

Security News
Polyfill.io has been serving malware for months via its CDN, after the project's open source maintainer sold the service to a company based in China.

Security News
OpenSSF is warning open source maintainers to stay vigilant against reputation farming on GitHub, where users artificially inflate their status by manipulating interactions on closed issues and PRs.