Product
Announcing Socket Fix 2.0
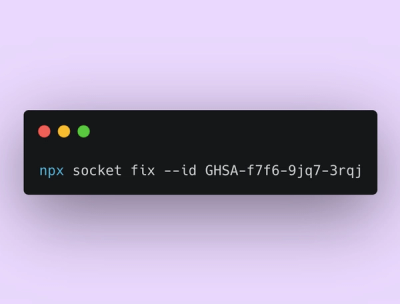
Socket Fix 2.0 brings targeted CVE remediation, smarter upgrade planning, and broader ecosystem support to help developers get to zero alerts.
@bmacnaughton/simple-bench
Advanced tools
simple-bench is a toolkit for executing JavaScript benchmarks; it is not a product that makes everything super-simple. It's been my experience that benchmarking requires thought and is rarely super-simple. So simple-bench tries to handle the basics and make it relatively easy to manipulate common settings.
simple-bench handles basic benchmarking tasks
While it is an npm package, it's not particularly convenient to install it as a dependency. Keep reading.
npm pack @bmacnaughton/simple-bench and
extract it where you want to work with it.benchmarks/definitions.js as an example, create your own benchmarks/definitions.js
file. it should export an object with the key tests. tests value is an object where
each key is a function to be benchmarked.node index.js key to run a benchmark function. key is one of the keys
in the tests object that was exported.node index.js func1 func2. in this example func2 will be passed
the return value of func1. this enables trying many different combinations without
having to hardcode a function for each.noop is predefined and can be used to evaluate the cost of a function
in a function-chain or of the framework itself.Command line (ENV) options:
The previous options are all boolean; if the env var exists, the option is set, even if the value is empty.
Environment-variable-only option:
Two lines per benchmark are output. The first is a short summary of what is being run; its primary purpose is visual feedback. The second is the benchmark results; it includes all the information from the summary as well as the following:
Example (formatted; output is not):
{
  "params": {
    "functionChain": ["tinyText", "split"],
    "warmupIterations": 10,
    "groupIterations": 100,
    "groupCount": 5,
    "groupWaitMS": 100,
    "stddevRange": 2
  },
  "gc": {
    "count": 2,
    "time": 2.8927321434020996
  },
  "raw": {
    "times": [
      1.8154609203338623,
      2.7900259494781494,
      0.5000760555267334,
      0.9043412208557129,
      0.5999069213867188
    ],
    "mean": 1.3219622135162354,
    "meanPerIteration": 0.013219622135162354,
    "stddev": 0.8683340488055122
  },
  "clean": {
    "times": [
      1.8154609203338623,
      2.7900259494781494,
      0.5000760555267334,
      0.9043412208557129,
      0.5999069213867188
    ],
    "lowRange": 0,
    "highRange": 3.05863031112726,
    "mean": 1.3219622135162354,
    "meanPerIteration": 0.013219622135162354,
    "stddev": 0.8683340488055122
  },
  "outliers": {
    "times": []
  }
}
Text output is intended for reading.
Example:
[function chain: tinyText, split]
[100 iterations x 5 groups (100ms intergroup pause)]
[gc count: 2, gc time: 4.031]
[group times: 1.87, 3.97, 0.87, 0.87, 0.56]
[raw group mean 1.629 stddev 1.252 (0.016 per iteration)]
[all group times within 0.00 to 4.13 (1.629 +/- 2 * 1.252)]
[mean: 0.01629 per iteration]
If there are outliers, the output is a little different:
[function chain: bigText, split]
[100 iterations x 5 groups (100ms intergroup pause)]
[gc count: 22, gc time: 7.594]
[group times: 6.17, 5.26, 4.48, 3.74, 3.83]
[raw group mean 4.699 stddev 0.917 (0.047 per iteration)]
[excluding times outside 4.699 +/- 0.92: 6.17, 3.74]
  [clean group mean 4.526 (0.045 per iteration) stddev 0.585]
[mean: 0.04526 per iteration]
See the example benchmark in benchmarks/definitions.js. The goal of the benchmark
is to compare different ways of splitting a log file into individual lines.
Key points:
simple-bench.sh is hand-coded to run each desired combination of source and
consumer.Typical output of simple-bench.sh is:
$ ./simple-bench.sh definitions
[function chain: tinyText, split]
[100000 iterations x 10 groups (1000ms intergroup pause)]
[gc count: 986, gc time: 77.888]
[group clean mean 85.779 raw stddev 5.479]
[mean: 0.0008578 per iteration]

[function chain: tinyText, regex]
[100000 iterations x 10 groups (1000ms intergroup pause)]
[gc count: 1061, gc time: 83.476]
[group clean mean 148.547 raw stddev 3.462]
[mean: 0.001485 per iteration]

[function chain: tinyText, lastIxString]
[100000 iterations x 10 groups (1000ms intergroup pause)]
[gc count: 969, gc time: 74.153]
[group clean mean 60.552 raw stddev 3.701]
[mean: 0.0006055 per iteration]


[function chain: bigText, split]
[100000 iterations x 10 groups (1000ms intergroup pause)]
[gc count: 5859, gc time: 444.208]
[group clean mean 607.719 raw stddev 30.326]
[mean: 0.006077 per iteration]

[function chain: bigText, regex]
[100000 iterations x 10 groups (1000ms intergroup pause)]
[gc count: 3426, gc time: 511.623]
[group clean mean 2281.062 raw stddev 60.194]
[mean: 0.02281 per iteration]

[function chain: bigText, lastIxString]
[100000 iterations x 10 groups (1000ms intergroup pause)]
[gc count: 5342, gc time: 399.592]
[group clean mean 478.940 raw stddev 28.984]
[mean: 0.004789 per iteration]


[function chain: tinyBuffer, lastIxBuffer]
[100000 iterations x 10 groups (1000ms intergroup pause)]
[gc count: 986, gc time: 73.766]
[group clean mean 118.157 raw stddev 3.669]
[mean: 0.001182 per iteration]


[function chain: bigBuffer, lastIxBuffer]
[100000 iterations x 10 groups (1000ms intergroup pause)]
[gc count: 5034, gc time: 479.090]
[group clean mean 1932.526 raw stddev 10.916]
[mean: 0.01933 per iteration]
From the output, it can be seen that the lastIxString approach is fastest.
Execution times reported for each group exclude everything other than executing the function-chain. The code:
async function test() {
  // call the tester's setup
  if (definitions.setup) {
    await (async() => definitions.setup(config))();
  }
  if (groupSetup) {
    await (async() => groupSetup(config))();
  }
  // warmup
  for (let i = warmupIterations; i > 0; i--) {
    await execute(functionChain);
  }
  await pause(groupWaitMS);

  // execute x groups of y iterations with a pause after each group
  for (let i = 0; i < groupCount; i++) {
    // setup for the group
    if (groupSetup) {
      await (async() => groupSetup(config))();
    }
    perf.mark('start-iteration');
    for (let i = groupIterations; i > 0; i--) {
      await execute(functionChain);
    }
    perf.measure('iteration-time', 'start-iteration');
    if (memory) {
      mem[i] = process.memoryUsage();
    }
    await pause(groupWaitMS);
  }

  // final pause
  await pause(groupWaitMS * 10);
  return pause(groupWaitMS);
}

//
// execute functionChains
//
async function execute(fc) {
  let lastResult = undefined;
  for (let i = 0; i < fc.length; i++) {
    lastResult = await fc[i](lastResult);
  }
}
The garbage collection counts and times include everything after the requires and
program initialization. it's not clear (to me anyway) how to identify which garbage
collections are associated with the code being benchmarked and which are not. the
best way to get a handle on the baseline garbage collections is to use the noop
built-in function as a baseline for comparison.
FAQs
benchmarking runner for node.js
The npm package @bmacnaughton/simple-bench receives a total of 0 weekly downloads. As such, @bmacnaughton/simple-bench popularity was classified as not popular.
We found that @bmacnaughton/simple-bench demonstrated a not healthy version release cadence and project activity because the last version was released a year ago. It has 1 open source maintainer collaborating on the project.
Did you know?

Socket for GitHub automatically highlights issues in each pull request and monitors the health of all your open source dependencies. Discover the contents of your packages and block harmful activity before you install or update your dependencies.

Product
Socket Fix 2.0 brings targeted CVE remediation, smarter upgrade planning, and broader ecosystem support to help developers get to zero alerts.

Security News
Socket CEO Feross Aboukhadijeh joins Risky Business Weekly to unpack recent npm phishing attacks, their limited impact, and the risks if attackers get smarter.

Product
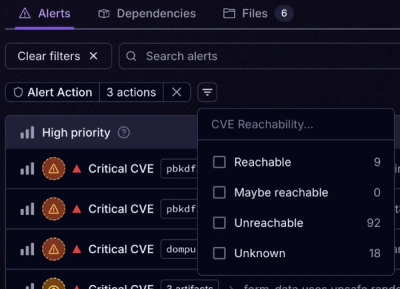
Socket’s new Tier 1 Reachability filters out up to 80% of irrelevant CVEs, so security teams can focus on the vulnerabilities that matter.