
Company News
Socket Has Acquired Secure Annex
Socket has acquired Secure Annex to expand extension security across browsers, IDEs, and AI tools.
By Feross Aboukhadijeh - Apr 28, 2026
@canvasjs/angular-stockcharts
Advanced tools
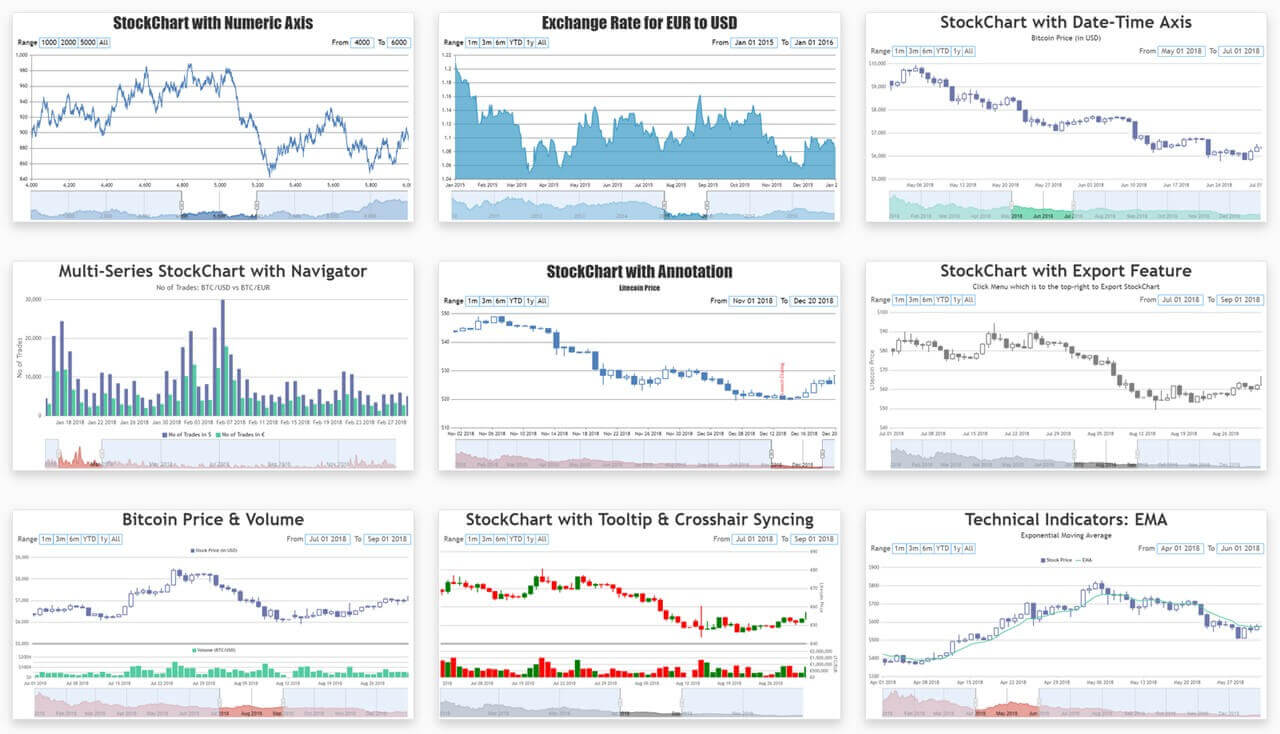
CanvasJS Angular StockChart Component for creating interactive stockchart for your web pages. Library supports a wide range of chart types including line, area, column, candlestick, etc.
Install CanvasJS StockCharts package to your Angular app
npm install @canvasjs/angular-stockcharts
See npm documentation to know more about npm usage.
Import the StockChart module into your Angular application (app.module.ts) & register it.
import { NgModule } from '@angular/core';
import { BrowserModule } from '@angular/platform-browser';

import { AppComponent } from './app.component';

import { CanvasJSAngularStockChartsModule } from '@canvasjs/angular-stockcharts';

@NgModule({
  declarations: [
	AppComponent
  ],
  imports: [
	BrowserModule,
	CanvasJSAngularStockChartsModule
  ],
  providers: [],
  bootstrap: [AppComponent]
})
export class AppModule { }
Set the stockchart-options in app.component.ts & use ‘canvasjs-stockchart’ selector in app.component.html to create stockchart.
//app.component.ts
import { Component } from '@angular/core';
@Component({
selector: 'app-root',
templateUrl: './app.component.html',
styleUrls: ['./app.component.css']
})
export class AppComponent {
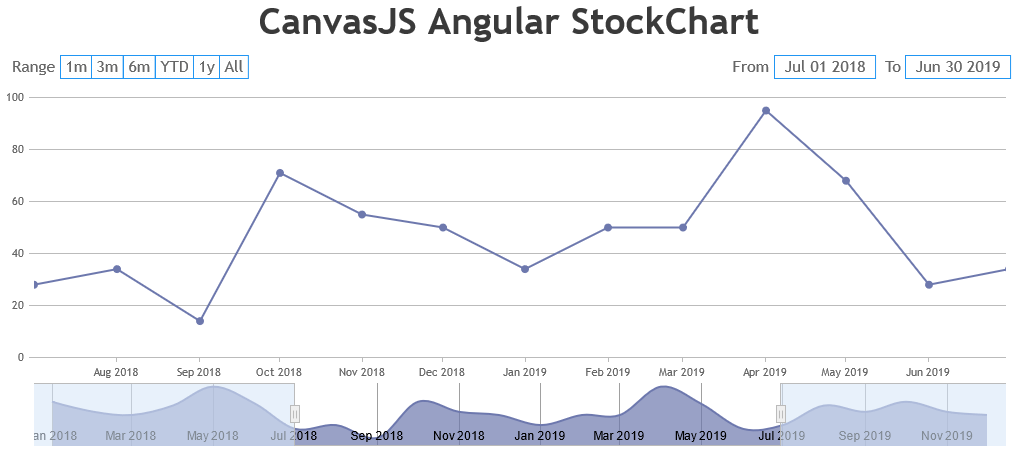
stockChartOptions = {
title: {
text: "CanvasJS Angular StockChart"
},
theme: "light2",
charts: [{
data: [{
type: "line",
dataPoints: [
{ x: new Date("2018-01-01"), y: 71 },
{ x: new Date("2018-02-01"), y: 55 },
{ x: new Date("2018-03-01"), y: 50 },
{ x: new Date("2018-04-01"), y: 65 },
{ x: new Date("2018-05-01"), y: 95 },
{ x: new Date("2018-06-01"), y: 68 },
{ x: new Date("2018-07-01"), y: 28 },
{ x: new Date("2018-08-01"), y: 34 },
{ x: new Date("2018-09-01"), y: 14 },
{ x: new Date("2018-10-01"), y: 71 },
{ x: new Date("2018-11-01"), y: 55 },
{ x: new Date("2018-12-01"), y: 50 },
{ x: new Date("2019-01-01"), y: 34 },
{ x: new Date("2019-02-01"), y: 50 },
{ x: new Date("2019-03-01"), y: 50 },
{ x: new Date("2019-04-01"), y: 95 },
{ x: new Date("2019-05-01"), y: 68 },
{ x: new Date("2019-06-01"), y: 28 },
{ x: new Date("2019-07-01"), y: 34 },
{ x: new Date("2019-08-01"), y: 65 },
{ x: new Date("2019-09-01"), y: 55 },
{ x: new Date("2019-10-01"), y: 71 },
{ x: new Date("2019-11-01"), y: 55 },
{ x: new Date("2019-12-01"), y: 50 }
]
}]
}],
navigator: {
slider: {
minimum: new Date("2018-07-01"),
maximum: new Date("2019-06-30")
}
}
}
}
//app.component.html
<div>
<canvasjs-stockchart [options]="stockChartOptions"></canvasjs-stockchart>
</div>
FAQs
CanvasJS Angular StockCharts - Official
We found that @canvasjs/angular-stockcharts demonstrated a not healthy version release cadence and project activity because the last version was released a year ago. It has 1 open source maintainer collaborating on the project.
Did you know?

Socket for GitHub automatically highlights issues in each pull request and monitors the health of all your open source dependencies. Discover the contents of your packages and block harmful activity before you install or update your dependencies.
Company News
Socket has acquired Secure Annex to expand extension security across browsers, IDEs, and AI tools.

Research
/Security News
Socket is tracking cloned Open VSX extensions tied to GlassWorm, with several updated from benign-looking sleepers into malware delivery vehicles.

Product
Reachability analysis for PHP is now available in experimental, helping teams identify which vulnerabilities are actually exploitable.