CanvasJS React StockCharts - Official
CanvasJS React StockChart Component for creating advanced interactive Financial Charts for your react applications. Library supports a wide range of chart types including line, area, candlestick, ohlc, etc.
Important Links
Installing CanvasJS React StockChart
Install CanvasJS React StockCharts to your application from npm.
Install React StockChart via NPM
npm install @canvasjs/react-stockcharts
See npm documentation to know more about npm usage.
Import React StockChart Component
Import the React StockChart module into your React application.
import CanvasJSReact from '@canvasjs/react-stockcharts';
//var CanvasJSReact = require('@canvasjs/react-stockcharts');

var CanvasJSStockChart = CanvasJSReact.CanvasJSStockChart;
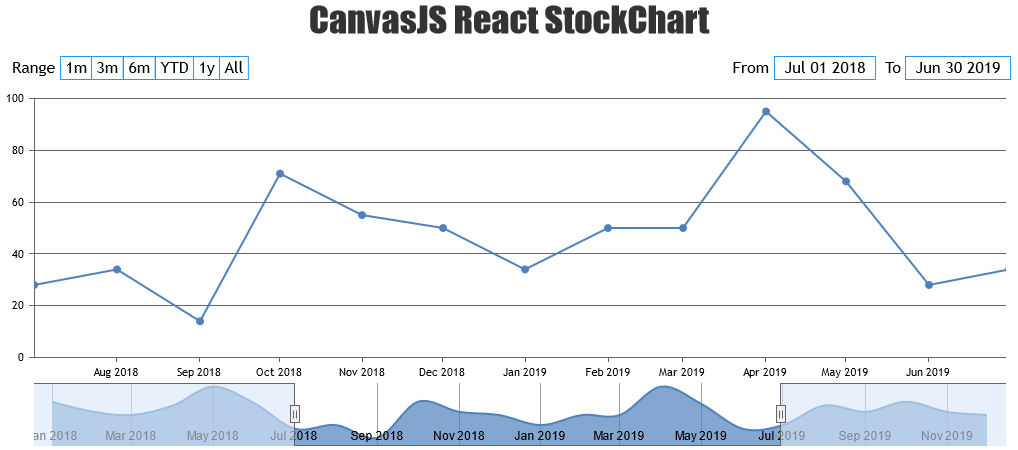
Set the stockchart-options & create chart
Set the stockchart-options & use 'CanvasJSStockChart' selector to create stockchart.
class App extends Component {
  render() {
    const options = {
      title: {
        text: "CanvasJS React StockChart"
      },
      charts: [{
        data: [{
          type: "line",
          dataPoints: [
            { x: new Date("2018-01-01"), y: 71 },
            { x: new Date("2018-02-01"), y: 55 },
            { x: new Date("2018-03-01"), y: 50 },
            { x: new Date("2018-04-01"), y: 65 },
            { x: new Date("2018-05-01"), y: 95 },
            { x: new Date("2018-06-01"), y: 68 },
            { x: new Date("2018-07-01"), y: 28 },
            { x: new Date("2018-08-01"), y: 34 },
            { x: new Date("2018-09-01"), y: 14 },
            { x: new Date("2018-10-01"), y: 71 },
            { x: new Date("2018-11-01"), y: 55 },
            { x: new Date("2018-12-01"), y: 50 },
            { x: new Date("2019-01-01"), y: 34 },
            { x: new Date("2019-02-01"), y: 50 },
            { x: new Date("2019-03-01"), y: 50 },
            { x: new Date("2019-04-01"), y: 95 },
            { x: new Date("2019-05-01"), y: 68 },
            { x: new Date("2019-06-01"), y: 28 },
            { x: new Date("2019-07-01"), y: 34 },
            { x: new Date("2019-08-01"), y: 65 },
            { x: new Date("2019-09-01"), y: 55 },
            { x: new Date("2019-10-01"), y: 71 },
            { x: new Date("2019-11-01"), y: 55 },
            { x: new Date("2019-12-01"), y: 50 }
          ]
        }]
      }],
      navigator: {
        slider: {
          minimum: new Date("2018-07-01"),
          maximum: new Date("2019-06-30")
        }
      }
    };

    return (
      <div>
        <CanvasJSStockChart options = { options }
          /* onRef = {ref => this.stockchart = ref} */
        />
      </div>
    );
  }
}
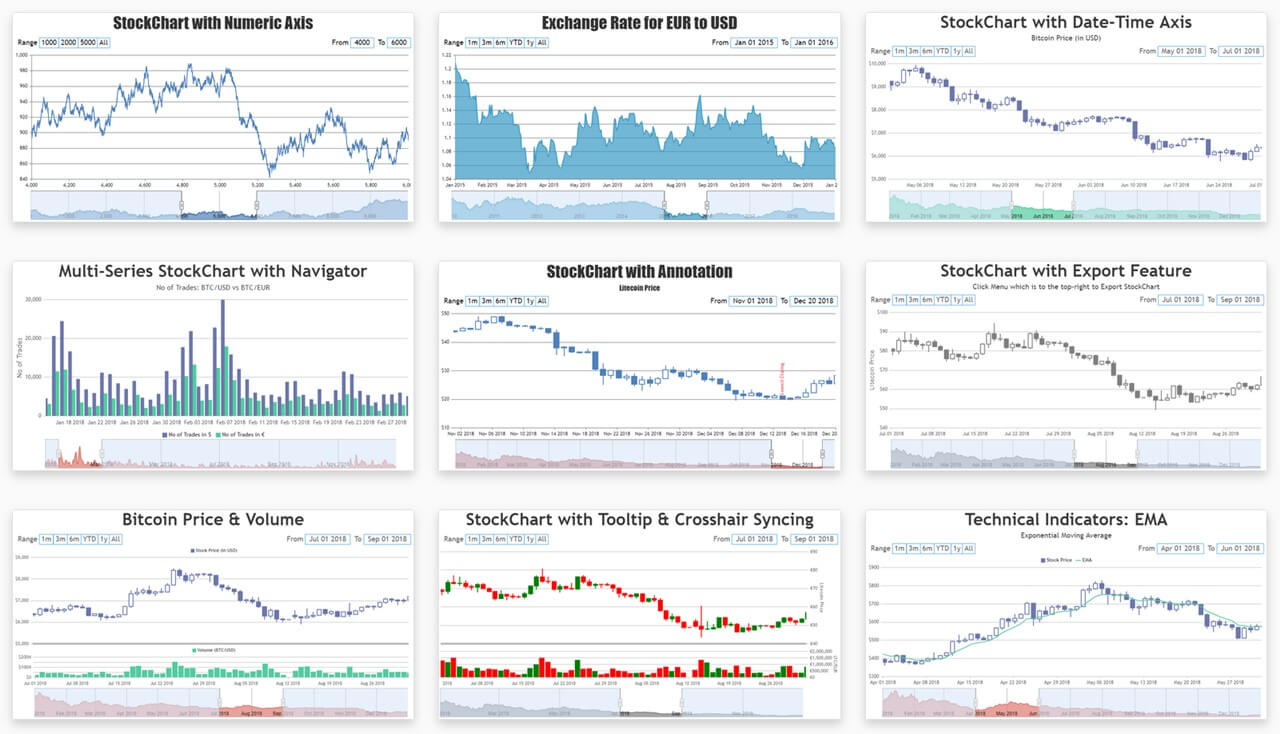
Interactive React StockCharts
Related StockChart Packages


