CanvasJS Vue StockCharts Plugin - Official
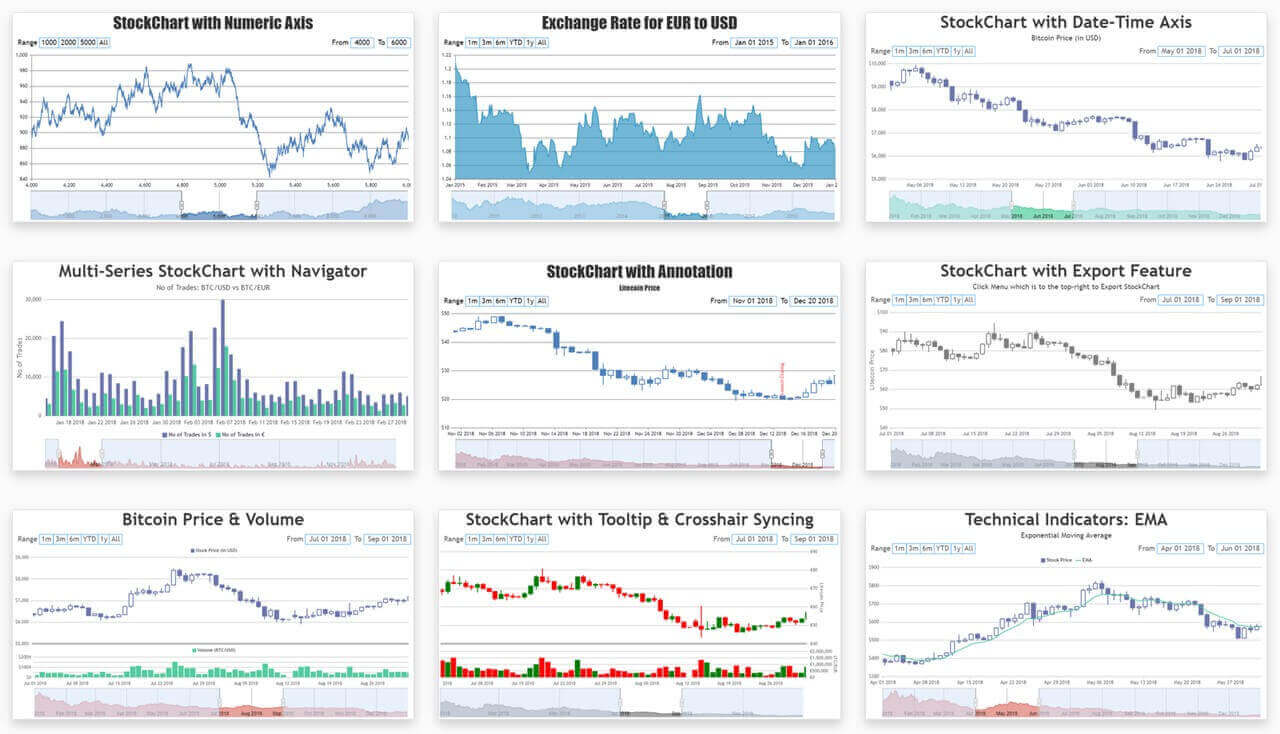
CanvasJS Vue StockChart Plugin for creating interactive financial charts and graphs for your Vue.js applications. Library supports a wide range of chart types including line, area, column, candlestick & more. It's also bundled with features like interactivity, animation, zooming / panning, exporting as image, etc.
Important Links
Installing CanvasJS Vue StockCharts
Install CanvasJS Vue StockCharts package to your Vue application via NPM.
Install Vue StockCharts via NPM
npm install @canvasjs/vue-stockcharts
See npm documentation to know more about npm usage.
Import Vue StockChart plugin & install it
Import the Vue StockCharts plugin to your Vue.js application & install it.
import { createApp } from 'vue'
import App from './App.vue'

import CanvasJSStockChart from '@canvasjs/vue-stockcharts';

const app = createApp(App);
app.use(CanvasJSStockChart); // install the CanvasJS Vuejs StockChart Plugin
app.mount('#app');
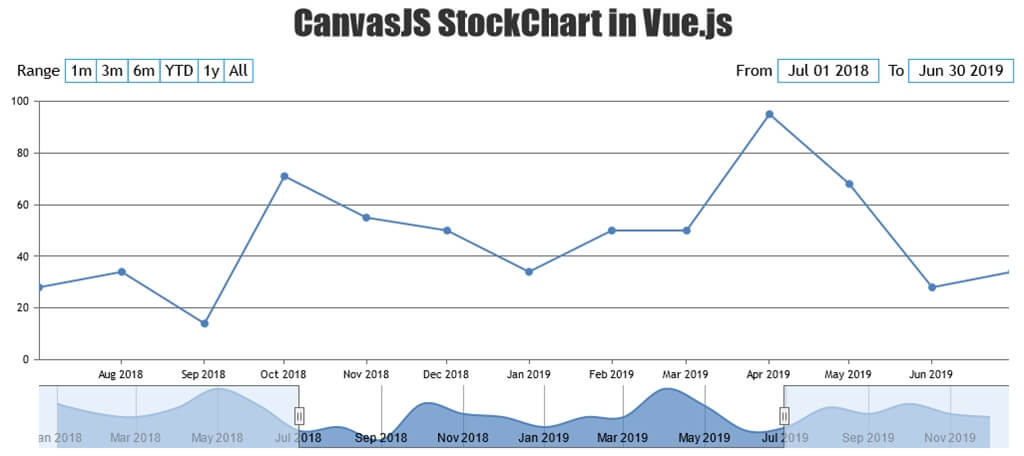
Set the stockchart-options & create stockchart
Set the stockchart-options in app.vue & use 'CanvasJSStockChart' selector to create StockChart inside template tag.
<!-- App.vue -->
<script>
export default {
  data() {
    return {
      options: {
        title: {
          text: "CanvasJS StockChart in Vue.js"
        },
        charts: [{
          data: [{
            type: "line",
            dataPoints: [
              { x: new Date("2018-01-01"), y: 71 },
              { x: new Date("2018-02-01"), y: 55 },
              { x: new Date("2018-03-01"), y: 50 },
              { x: new Date("2018-04-01"), y: 65 },
              { x: new Date("2018-05-01"), y: 95 },
              { x: new Date("2018-06-01"), y: 68 },
              { x: new Date("2018-07-01"), y: 28 },
              { x: new Date("2018-08-01"), y: 34 },
              { x: new Date("2018-09-01"), y: 14 },
              { x: new Date("2018-10-01"), y: 71 },
              { x: new Date("2018-11-01"), y: 55 },
              { x: new Date("2018-12-01"), y: 50 },
              { x: new Date("2019-01-01"), y: 34 },
              { x: new Date("2019-02-01"), y: 50 },
              { x: new Date("2019-03-01"), y: 50 },
              { x: new Date("2019-04-01"), y: 95 },
              { x: new Date("2019-05-01"), y: 68 },
              { x: new Date("2019-06-01"), y: 28 },
              { x: new Date("2019-07-01"), y: 34 },
              { x: new Date("2019-08-01"), y: 65 },
              { x: new Date("2019-09-01"), y: 55 },
              { x: new Date("2019-10-01"), y: 71 },
              { x: new Date("2019-11-01"), y: 55 },
              { x: new Date("2019-12-01"), y: 50 }
            ]
          }]
        }],
        navigator: {
          slider: {
            minimum: new Date("2018-07-01"),
            maximum: new Date("2019-06-30")
          }
        }
      }
    }
  }
}
</script>
<template>
  <CanvasJSStockChart :options="options" />
</template>
Interactive Vue StockChart
Related StockChart Packages