Product
Announcing Bun and vlt Support in Socket
Bringing supply chain security to the next generation of JavaScript package managers
@datagrok/chem
Advanced tools
Cheminformatics support: import, rendering, sketching, calculation of properties, predictive models, augmentations, multiple analyses.
This package provides first-class cheminformatics support for the Datagrok platform. See it in action on YouTube.
The Datagrok platform provides rich exploratory data analysis capabilities, advanced data mining techniques such as multivariate analysis and stochastic proximity embedding, and out-of-the-box support for predictive modeling and scientific computations. By providing first-class cheminformatics support, this package turns Datagrok into a comprehensive platform for working with chemical and biological data.
Regarding the performance, our goal is to be able to open chemical datasets of up to 10 millions small molecules completely in the browser, and interactively perform commonly used operations such as substructure and similarity search without having to rely on a server. In order to hit these goals, we are using a couple of techniques. First of all, we are leveraging Datagrok's capability to efficiently work with relational data. For cheminformatics, we are relying on the RDKit library compiled to WebAssembly. This not only gives us the ability to execute C++ code at the native speed, but also take full advantage of the modern multicore CPUs by running computations in multiple threads.
Here are some of the features:
The following features are still in the core, but we plan to move them out to this package:
Supports multiple sketchers (MarvinJS, OpenChemLib, Ketcher).
You can set the default Sketcher in the package property so that new users won't have to switch on the first use manually:

Access the recently sketched structures from the ☰ -> Recent menu.
☰ -> Favorites contains your favorite structures. To add current molecule
to the favorites, click on ☰ -> Favorites -> Add to Favorites.
Out-of-the-box, you can paste SMILES, MOLBLOCK, and InChi keys into the input field, and the sketcher automatically translates it to a structure. In addition to that, you can make sketcher understand other structure notations (such as from your company's internal database of structures) by registering a function annotated in a special way. The following example provides support for Chembl. The important tags are:
--meta.role: converter: indicates that such a function serves as a value converter--meta.inputRegexp: (CHEMBL[0-9]+): RegExp that is evaluated to check if this function
is applicable to the user input. The captured group (in this case the whole input) is then
passed to this function as a parameter.--output: string smiles { semType: Molecule }: should return string with the semType Molecule--name: chemblIdToSmiles
--meta.role: converter
--meta.inputRegexp: (CHEMBL[0-9]+)
--connection: Chembl
--input: string id = "CHEMBL1185"
--output: string smiles { semType: Molecule }
select canonical_smiles from compound_structures s
join molecule_dictionary d on s.molregno = d.molregno
where d.chembl_id = @id

A molecule query does not have to be a database query, any function will do. For instance, InChi query is implemented as a Python script.
Elemental Analysis lets you extract, visualize, and compare atom counts for the molecules in your dataset.
With this tool you can:
To run Elemental Analysis, select Chem | Elemental Analysis from the main menu.
Radar chart can be visualized in 2 ways:


Tool that help scientists analyze a collection of molecules in terms of molecular similarity. It is based on applying different distance metrics (such as Tanimoto) to fingerprints.
Similarity search returns a set of N molecules most similar to the selected one. To run Similarity search select Chem | Search | Similarity search from the top menu.

To change target molecule select the row with required molecule in the initial dataframe. Similarities will be recalculated.
Target molecule can be also changed by using edit button in the top left corner of the molecule pane.

Using context panel you can change search metrics like similarity cut off, fingerprints type or distance metric.
By selecting columns from Molecule Properties field you can add any fields present in your dataframe to similarity panes. Please note that if color coding is applied to a selected column it will be copied on a similarity pane. You can select to highlight background or text in the corresponding field. Ability to add fields to similarity panes simplifies analysis since multiple molecules characteristics can be easily assessed at once.

Diversity search finds N most distinct molecules. To run Similarity search select Chem | Search | Diversity search from the top menu. As for Similarity search, you can adjust metrics or add fields to molecule panes using context panel.

We offer a highly efficient and fast substructure search capability that can handle datasets of any size, including millions of molecules.
Here are the advantages of our approach:
There are two ways to run a substructure search:
Top menu -> Chem -> Search -> Substructure Search...In both cases, a filter opens on the right side of the table.
To conduct a search:
Click to edit pane for the desired column. The molecule sketcher opensClicking OK during the active search closes the sketcher, but the search continues. Clicking Cancel terminates the active search. Additionally, you can modify the substructure during an active search, and the results will recalculate instantly.
Here is an example:

We offer the following search types:
To run any of above searches:
Click Filter icon on a toolbox. The filter panel opens. The default search type is Contains. Change the search type by selecting from a dropdown list.
Click Click to edit pane for the desired column. The molecule sketcher opens
Sketch some substructure. The search starts immediately.

In case of Contains the search options are hidden by default. To open them hover over molecule and click the settings icon.

We offer highlighting of multiple molecule fragments inside one molecule structure. Multiple fragments can be highlighted with different colors.
To add a fragment use:
Context panel
context panelChemistry -> HighlightClick to edit. Molecule sketcher opens. Sketch some structure. It is highlighted immediately in the column.
Structural alerts widget
context panelBiology -> Structural Alertsmore icon. In the popup menu select Highlight fragment and choose color. Fragment is highlighted in the column.
We have seamlessly integrated Scaffold Tree with molecule fragments highlighting. To utilize this feature, we have introduced two icons:
Here are some important rules:
Scaffolds are highlighted both in the column and viewer for the convenience.
In addition, we updated and improved the existing functionality:

R-group analysis decomposes a set of molecules into a core and R-groups (ligands at certain attachment positions), and visualizes the results. The query molecule consists of the scaffold and ligand attachment points represented by R-groups. R-group analysis runs directly in browser using RDKit JS library.
To run R-Group analysis:
R-groups are highlighted with different colors in the initial molecules in dataframe. Molecules are automatically aligned by core. To filter molecules which have R groups in each enumerated position use isMatch column.
The trellis plot initially displays pie charts. To change the chart type, use the Viewer control in the top-left corner to select a different viewer.
If you prefer not to use a trellis plot, close it or clear the Visual analysis checkbox during Step 2. You can manually add it later. You can also use other chemical viewers, like scatterplot, box plot, bar chart, and others.
Use Replace latest checkbox to remove previous analysis results when running the new one. Or check it to add new analysis results in addition to existing.

Datagrok enables conversion between molecular formats like SMILES, SMARTS, Molfile V2000, and Molfile V3000, simplifying workflow processes.
To run, go to Chem > Transform > Convert Notation... and configure parameters:

See also:
FAQs
Cheminformatics support: import, rendering, sketching, calculation of properties, predictive models, augmentations, multiple analyses.
The npm package @datagrok/chem receives a total of 111 weekly downloads. As such, @datagrok/chem popularity was classified as not popular.
We found that @datagrok/chem demonstrated a healthy version release cadence and project activity because the last version was released less than a year ago. It has 5 open source maintainers collaborating on the project.
Did you know?

Socket for GitHub automatically highlights issues in each pull request and monitors the health of all your open source dependencies. Discover the contents of your packages and block harmful activity before you install or update your dependencies.

Product
Bringing supply chain security to the next generation of JavaScript package managers

Product
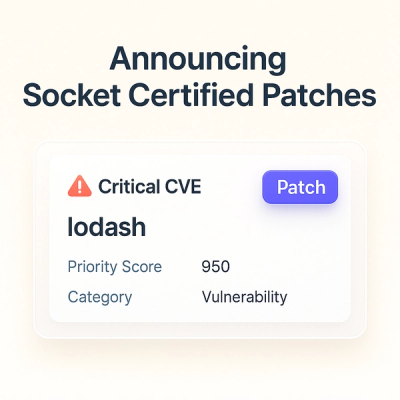
A safer, faster way to eliminate vulnerabilities without updating dependencies

Product
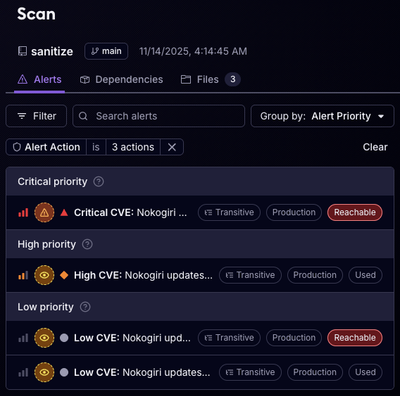
Reachability analysis for Ruby is now in beta, helping teams identify which vulnerabilities are truly exploitable in their applications.