Research
Security News
Lazarus Strikes npm Again with New Wave of Malicious Packages
The Socket Research Team has discovered six new malicious npm packages linked to North Korea’s Lazarus Group, designed to steal credentials and deploy backdoors.
@deck.gl/aggregation-layers
Advanced tools
deck.gl layers that aggregate the input data into alternative representations
@deck.gl/aggregation-layers is a collection of Deck.gl layers designed for data aggregation and visualization. These layers are optimized for rendering large datasets and provide various aggregation techniques such as grid-based, hexagon-based, and contour-based visualizations.
GridLayer
The GridLayer aggregates data into a grid-based heatmap. Each cell in the grid represents the aggregated data points within that cell. This is useful for visualizing density and distribution of data points over a geographic area.
const {Deck} = require('@deck.gl/core');
const {GridLayer} = require('@deck.gl/aggregation-layers');
const deck = new Deck({
initialViewState: {
longitude: -122.45,
latitude: 37.8,
zoom: 12
},
controller: true,
layers: [
new GridLayer({
id: 'grid-layer',
data: 'https://raw.githubusercontent.com/visgl/deck.gl-data/master/website/sf-bike-parking.json',
pickable: true,
extruded: true,
cellSize: 200,
elevationScale: 4,
getPosition: d => d.COORDINATES
})
]
});HexagonLayer
The HexagonLayer aggregates data into hexagonal bins, providing a hexagon-based heatmap. This is useful for visualizing spatial patterns and density in a more visually appealing way compared to grid-based aggregation.
const {Deck} = require('@deck.gl/core');
const {HexagonLayer} = require('@deck.gl/aggregation-layers');

const deck = new Deck({
  initialViewState: {
    longitude: -122.45,
    latitude: 37.8,
    zoom: 12
  },
  controller: true,
  layers: [
    new HexagonLayer({
      id: 'hexagon-layer',
      data: 'https://raw.githubusercontent.com/visgl/deck.gl-data/master/website/sf-bike-parking.json',
      pickable: true,
      extruded: true,
      radius: 200,
      elevationScale: 4,
      getPosition: d => d.COORDINATES
    })
  ]
});
ContourLayer
The ContourLayer generates contour lines based on the density of data points. This is useful for visualizing areas of high and low concentration, similar to topographic maps.
const {Deck} = require('@deck.gl/core');
const {ContourLayer} = require('@deck.gl/aggregation-layers');

const deck = new Deck({
  initialViewState: {
    longitude: -122.45,
    latitude: 37.8,
    zoom: 12
  },
  controller: true,
  layers: [
    new ContourLayer({
      id: 'contour-layer',
      data: 'https://raw.githubusercontent.com/visgl/deck.gl-data/master/website/sf-bike-parking.json',
      pickable: true,
      contours: [{threshold: 1, color: [255, 0, 0], strokeWidth: 2}],
      cellSize: 200,
      getPosition: d => d.COORDINATES
    })
  ]
});Leaflet.heat is a simple heatmap plugin for Leaflet. It provides basic heatmap functionality and is easy to use for small to medium-sized datasets. Compared to @deck.gl/aggregation-layers, it is less feature-rich and not optimized for very large datasets.
Heatmap.js is a JavaScript library for creating heatmaps. It is highly customizable and can handle large datasets efficiently. However, it does not provide the same level of integration with mapping libraries as @deck.gl/aggregation-layers.
Kepler.gl is a powerful open-source geospatial analysis tool for large-scale data sets. It offers a wide range of visualization options, including heatmaps, but is more of a standalone application compared to the modular approach of @deck.gl/aggregation-layers.
FAQs
deck.gl layers that aggregate the input data into alternative representations
The npm package @deck.gl/aggregation-layers receives a total of 131,381 weekly downloads. As such, @deck.gl/aggregation-layers popularity was classified as popular.
We found that @deck.gl/aggregation-layers demonstrated a healthy version release cadence and project activity because the last version was released less than a year ago. It has 0 open source maintainers collaborating on the project.
Did you know?

Socket for GitHub automatically highlights issues in each pull request and monitors the health of all your open source dependencies. Discover the contents of your packages and block harmful activity before you install or update your dependencies.

Research
Security News
The Socket Research Team has discovered six new malicious npm packages linked to North Korea’s Lazarus Group, designed to steal credentials and deploy backdoors.

Security News
Socket CEO Feross Aboukhadijeh discusses the open web, open source security, and how Socket tackles software supply chain attacks on The Pair Program podcast.

Security News
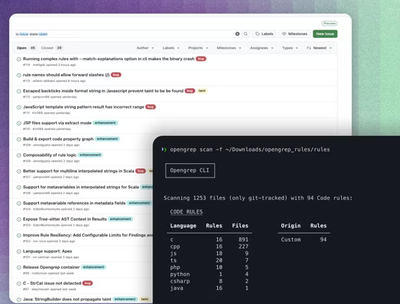
Opengrep continues building momentum with the alpha release of its Playground tool, demonstrating the project's rapid evolution just two months after its initial launch.