Product
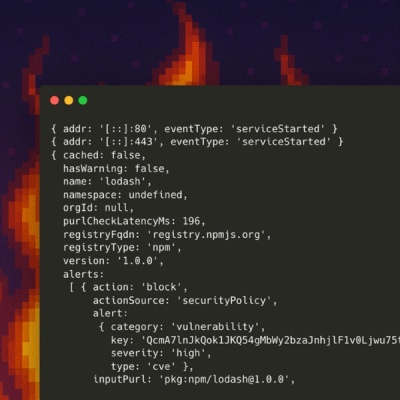
Introducing Socket Firewall Enterprise: Flexible, Configurable Protection for Modern Package Ecosystems
Socket Firewall Enterprise is now available with flexible deployment, configurable policies, and expanded language support.
@domoinc/button
Advanced tools
Here goes a brief description of your widget

this._config = {
height: { // Name of config Item
name: 'Chart Height', // [Optional] - This is the human readable name for this config item in Title Case. It should only be set if this is something that an end user would want to configure.
description: 'Height of the chart.', // Human readable description.
type: 'number', // [Optional] - Value type. Will be used for UI elements in future.
value: 100 // Default value for item
},
width: {
name: 'Chart Width'
description: 'Width of the chart.',
type: 'number',
value: 100
},
shouldValidate: {
description: 'Flag for turning off data validation.',
type: 'boolean',
value: true
},
chartName: {
description: 'Name of chart for Reporting.',
type: 'string',
value: 'Button'
}
};
//----------------------------------------------------------------------------------
// Data Definition:
// Set functions on how to access and validate data values.
//----------------------------------------------------------------------------------
_Chart._newDataDefinition = {
	'Label': {
		type: 'string', 													// Expected type for column...
		validate: function (d) { return this.accessor(d) !== undefined; }, 	// Validation function
		accessor: function (line) { return String(line[0]); }, 				// Accessor function
	},
	'Value': {
		type: 'number',
		validate: function (d) { return !isNaN(this.accessor(d)) && this.accessor(d) >= 0; },
		accessor: function (line) { return Number(line[1]); },
	}
};
//Setup some fake data
var data = [
	[1,2,3],
	[4,5,6],
	[7,8,9]
];

//Initialze the widget
var chart = d3.select("#vis")
	.append("svg")
	.append("g")
	.attr("transform", "translate(50,50)")
	.chart("Button")
	.width(250)
	.height(250);

//Render the chart with data
chart._notifier.showMessage(true);
chart.draw(data);
FAQs
Did you know?

Socket for GitHub automatically highlights issues in each pull request and monitors the health of all your open source dependencies. Discover the contents of your packages and block harmful activity before you install or update your dependencies.

Product
Socket Firewall Enterprise is now available with flexible deployment, configurable policies, and expanded language support.

Security News
Open source dashboard CNAPulse tracks CVE Numbering Authorities’ publishing activity, highlighting trends and transparency across the CVE ecosystem.

Product
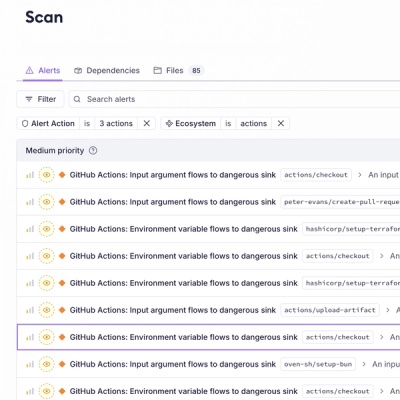
Detect malware, unsafe data flows, and license issues in GitHub Actions with Socket’s new workflow scanning support.