Product
Announcing Socket Fix 2.0
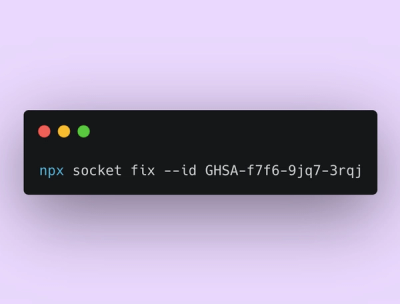
Socket Fix 2.0 brings targeted CVE remediation, smarter upgrade planning, and broader ecosystem support to help developers get to zero alerts.
@hapipal/hpal-debug
Advanced tools
hapijs debugging tools for the hpal CLI
Lead Maintainer - Devin Ivy
hpal-debug was designed to help you,
hpal run debug:routes --show cors
hpal run debug:repl
hpal run debug:curl post /user --name Pal -v
If you're getting started with the pal boilerplate, then your project is already setup with hpal-debug!
Install the hpal-debug package from npm as a dev dependency.
npm install --save-dev @hapipal/hpal-debug
Register hpal-debug on your server as a hapi plugin.
await server.register(require('@hapipal/hpal-debug'));
Ensure server.js or server/index.js exports a function named deployment that returns your configured hapi server.
Below is a very simple example of boilerplate code to configure a hapi server server, and is not necessarily "production-ready." For a more complete setup, consider using the pal boilerplate, or check-out its approach as seen here.
// server.js

'use strict';

const Hapi = require('hapi');
const AppPlugin = require('./app');

// hpal will look for and use exports.deployment()
// as defined below to obtain a hapi server

exports.deployment = async ({ start } = {}) => {

    const server = Hapi.server();

    // Assuming your application (its routes, etc.) live in a plugin
    await server.register(AppPlugin);

    if (process.env.NODE_ENV !== 'production') {
        await server.register(require('@hapipal/hpal-debug'));
    }

    if (start) {
        await server.start();
        console.log(`Server started at ${server.info.uri}`);
    }

    return server;
};

// Start the server only when this file is
// run directly from the CLI, i.e. "node ./server"

if (!module.parent) {
    exports.deployment({ start: true });
}
And that's it! Now the hpal-debug commands should be available through the hpal CLI. A simple way to check that hpal-debug is setup correctly is to output a pretty display of your route table,
npx hpal run debug:routes
hpal-debug is intended for use with hapi v19+ and nodejs v12+ (see v1 for lower support).
hpal run debug:routeshpal run debug:routes [<route-identifier>] --hide <column-name> --show <column-name> e.g. hpal run debug:routes --show cors
This command outputs a neat display of your server's route table.
In order to display a single route, you may specify <route-identifier> as a route id (e.g. user-create), route method and path (e.g. post /users), or route path (e.g. /users, method defaulting to get).
Columns may be hidden or shown using the -H --hide and -s --show flags respectively. Use the flag multiple times to hide or show multiple columns. Below is the list of available columns.
method path id plugin vhost auth cors tags description
The -r --raw flag will output a minimally formatted table with columns separated by tab characters. Non-TTY usage automatically defaults to raw output.
A summary of these options can be displayed with the -h --help flag.
hpal run debug:replhpal run debug:repl
This command starts a fully-featured interactive REPL with your initialized server in context. Each of your server's methods, properties, schwifty models, and schmervice services are also made directly available for convenience. Under hpal v2 you can use top-level await. You may also call this command using hpal run debug.
$ hpal run debug:repl

hpal> server.info                 // you can always use the server directly
{ created: 1527567336111,
  started: 0,
  host: 'your-computer.local',
  ...
hpal>                             // or you can omit the "server." for public properties and methods...
hpal>
hpal> info.uri                    // at what URI would I access my server?
'http://your-computer.local'
hpal> Object.keys(registrations)  // what plugins are registered?
[ '@hapipal/hpal-debug', 'my-app' ]
hpal> table().length              // how many routes are defined?
12
hpal> !!match('get', '/my/user')  // does this route exist?
true
hpal> .exit
hpal run debug:curlhpal run debug:curl <route-identifier> [<route-parameters>] --data <raw-payload> --header <header-info> --raw --verbose e.g. hpal run debug:curl post /users --firstName Paldo -v
This command makes a request to a route and displays the result. Notably, you don't need a running server in order to test your route using hpal run debug:curl!
It's required that you determine which route to hit by specifying a <route-identifier> as a route id (e.g. user-create), route method and path (e.g. post /users), or route path (e.g. /users, method defaulting to get).
You may specify any payload, query, or path params as <route-parameters> flags or in the <route-identifier>. Any parameter that utilizes Joi validation through route.options.validate has a command line flag. For example, a route with id user-update, method patch, and path /user/{id} that validates the id path parameter and a hometown payload parameter might be hit using the following commands,
hpal run debug:curl patch /user/42 --hometown "Buenos Aires"

# or

hpal run debug:curl user-update --id 42 --hometown "Buenos Aires"
Nested parameters may also be specified. If the route in the previous example validated payloads of the form { user: { hometown } }, one might use one of the following commands instead,
hpal run debug:curl user-update --id 42 --user-hometown "Buenos Aires"

# or

hpal run debug:curl user-update --id 42 --user '{ "hometown": "Buenos Aires" }'
The -d --data flag may be used to specify a request payload as a raw string.
The -H --header flag may be used to specify a request header in the format header-name: header value. This flag may be used multiple times to set multiple headers.
The -r --raw and -v --verbose flags affect the command's output, and may be used in tandem with each other or separately. The -r --raw flag ensures all output is unformatted, while the -v --verbose flag shows information about the request and response including timing, the request payload, request headers, response headers, status code, and response payload. Non-TTY usage automatically defaults to raw output.
A summary of these options can be displayed with the -h --help flag.
$ hpal run debug:curl /user -v

get /user (30ms)

request headers
───────────────────────────────────────────────────────────────────
 user-agent    shot
 host          your-computer.local:0

response headers
───────────────────────────────────────────────────────────────────
 content-type      application/json; charset=utf-8
 vary              origin
 cache-control     no-cache
 content-length    55
 accept-ranges     bytes

result (200 ok)
───────────────────────────────────────────────────────────────────
{
  id: 42,
  firstName: 'Paldo',
  hometown: 'Buenos Aires'
}
FAQs
hapijs debugging tools for the hpal CLI
We found that @hapipal/hpal-debug demonstrated a not healthy version release cadence and project activity because the last version was released a year ago. It has 3 open source maintainers collaborating on the project.
Did you know?

Socket for GitHub automatically highlights issues in each pull request and monitors the health of all your open source dependencies. Discover the contents of your packages and block harmful activity before you install or update your dependencies.

Product
Socket Fix 2.0 brings targeted CVE remediation, smarter upgrade planning, and broader ecosystem support to help developers get to zero alerts.

Security News
Socket CEO Feross Aboukhadijeh joins Risky Business Weekly to unpack recent npm phishing attacks, their limited impact, and the risks if attackers get smarter.

Product
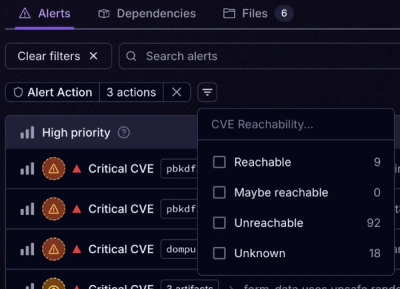
Socket’s new Tier 1 Reachability filters out up to 80% of irrelevant CVEs, so security teams can focus on the vulnerabilities that matter.