Security News
Risky Biz Podcast: Making Reachability Analysis Work in Real-World Codebases
This episode explores the hard problem of reachability analysis, from static analysis limits to handling dynamic languages and massive dependency trees.
@lengoo/logger
Advanced tools
Lengoo logger is a small wrapper of winston logger tailored to the team needs.
By default when used in development, it logs the defined events to the standard output, in production or staging, it can be connected to an APM agent and also write KPIs about the service.
To install this package is enough to execute:
npm install --save @lengoo/logger
Or for yarn users:
yarn add @lengoo/logger
In order to make APM works, some configuration has to be provided in the form of environment variables, an example is as following:
APM_SERVER="http://localhost:8200"
APP_NAME="boilerplate"
If APM_SERVER is not defined in the environment, the logger will only print out to the stdout, will not write any kpi to the APM agent.
As mentioned before, all the configuration is managed by environment variables, there are some optionals and some other mandatories for the correct working of the library:
NODE_ENV=development
APP_NAME=<app_name> # mandatory, will define the name of the logs in the index.
APM_SERVER="http://localhost:8200" # optional, if not defined, will not connect to an APM server.
In order to use this library, you should import it first:
const Logger = require('@lengoo/logger');
There are different levels of logging that are defined by the severity of the event you want to log, in this package, the severity levels are being kept from winston, and are the following:
const levels = {
  error: 0,
  warn: 1,
  info: 2,
  verbose: 3,
  debug: 4
};
Being each key a method in the package, you can log by calling them:
Logger.error('This is a message');
Each method contained by the package accepts either a string or an object, so it is possible to do something like:
Logger.error('This is an error message');
// or
Logger.error({
  code: 'not-found',
  message: 'Not Found',
  trace: err.stack.toString(),
})
In the first case, the resulting log will contain the following structure:
{
  "@timestamp": "2019-01-16T11:32:03.555Z",
  "message": "This is an error message",
  "severity": "error",
}
In the second case, you will have a little bit more complex structure:
{
  "@timestamp": "2019-01-16T11:32:03.555Z",
    "message": "Not found",
    "severity": "error",
    "fields": {
      "metadata": {
        "code": "not-found",
        "trace": "at hello_world.js line 1",
        "timestamp": "2019-01-16T11:32:03.552Z"
      }
    }
}
If you notice, you will always have consistency with timestamp, message and severity in the resulting log structure, and if you need to add extra data to the log, you can do it and this will be stored in a metadata field located inside fields object, this is meant for elasticsearch to keep consistency accross indices.
FAQs
Small winston wrapper tailored to lengoo needs
The npm package @lengoo/logger receives a total of 0 weekly downloads. As such, @lengoo/logger popularity was classified as not popular.
We found that @lengoo/logger demonstrated a not healthy version release cadence and project activity because the last version was released a year ago. It has 7 open source maintainers collaborating on the project.
Did you know?

Socket for GitHub automatically highlights issues in each pull request and monitors the health of all your open source dependencies. Discover the contents of your packages and block harmful activity before you install or update your dependencies.

Security News
This episode explores the hard problem of reachability analysis, from static analysis limits to handling dynamic languages and massive dependency trees.

Security News
/Research
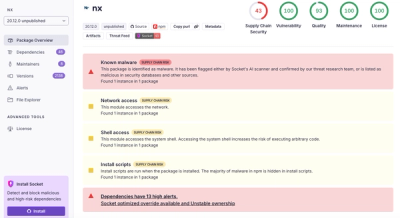
Malicious Nx npm versions stole secrets and wallet info using AI CLI tools; Socket’s AI scanner detected the supply chain attack and flagged the malware.

Security News
CISA’s 2025 draft SBOM guidance adds new fields like hashes, licenses, and tool metadata to make software inventories more actionable.