Product
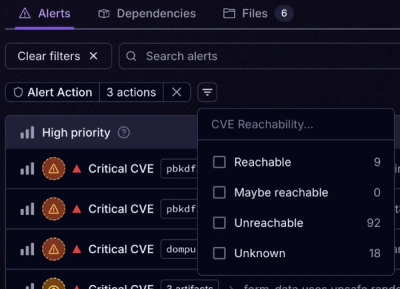
Introducing Tier 1 Reachability: Precision CVE Triage for Enterprise Teams
Socket’s new Tier 1 Reachability filters out up to 80% of irrelevant CVEs, so security teams can focus on the vulnerabilities that matter.
@lenicdev/react-lightweight-charts
Advanced tools
A simple react wrapper for the tradingview lightweight charts module
React.js wrapper for Lightweight Charts to build interactive financial charts in react.
npm install --save @lenicdev/react-lightweight-charts
yarn add @lenicdev/react-lightweight-charts
import Chart from '@lenicdev/react-lightweight-charts'
To create a basic candlestick chart, write as follows:
class App extends Component {
  constructor(props) {
    super(props);

    this.state = {
      options: {
        alignLabels: true,
        timeScale: {
          rightOffset: 12,
          barSpacing: 3,
          fixLeftEdge: true,
          lockVisibleTimeRangeOnResize: true,
          rightBarStaysOnScroll: true,
          borderVisible: false,
          borderColor: "#fff000",
          visible: true,
          timeVisible: true,
          secondsVisible: false
        }
      },
      candlestickSeries: [{
        data: [
          { time: '2018-10-19', open: 180.34, high: 180.99, low: 178.57, close: 179.85 },
          { time: '2018-10-22', open: 180.82, high: 181.40, low: 177.56, close: 178.75 },
          { time: '2018-10-23', open: 175.77, high: 179.49, low: 175.44, close: 178.53 },
          { time: '2018-10-24', open: 178.58, high: 182.37, low: 176.31, close: 176.97 },
          { time: '2018-10-25', open: 177.52, high: 180.50, low: 176.83, close: 179.07 },
          { time: '2018-10-26', open: 176.88, high: 177.34, low: 170.91, close: 172.23 },
          { time: '2018-10-29', open: 173.74, high: 175.99, low: 170.95, close: 173.20 },
          { time: '2018-10-30', open: 173.16, high: 176.43, low: 172.64, close: 176.24 },
          { time: '2018-10-31', open: 177.98, high: 178.85, low: 175.59, close: 175.88 },
          { time: '2018-11-01', open: 176.84, high: 180.86, low: 175.90, close: 180.46 },
          { time: '2018-11-02', open: 182.47, high: 183.01, low: 177.39, close: 179.93 },
          { time: '2018-11-05', open: 181.02, high: 182.41, low: 179.30, close: 182.19 }
        ]
      }]
    }
  }

  render() {
    return (
      <Chart options={this.state.options} candlestickSeries={this.state.candlestickSeries} autoWidth height={320} />
    )
  }
}
| Name | Type | Description |
|---|---|---|
options | object | Defines the global options of the chart. Refer to the official Docs |
autoWidth | boolean | If true, the chart resizes automatically to 100% of its container width |
autoHeight | boolean | If true, the chart resizes automatically to 100% of its container height |
width | number | if autoWidth is false, defines the width of the chart in px |
height | number | if autoHeight is false, defines the height of the chart in px |
legend | string | Display a global legend on the top-left corner of the chart (can be considered as a title) |
candlestickSeries | SeriesObject list | List of candlestick series to be displayed |
barSeries | SeriesObject list | List of bar series to be displayed |
lineSeries | SeriesObject list | List of line series to be displayed |
areaSeries | SeriesObject list | List of area series to be displayed |
histogramSeries | SeriesObject list | List of histogram series to be displayed |
onClick | MouseEventHandler | Subscribe to click events. The callback function is defined in the official Docs |
onCrosshairMove | MouseEventHandler | Subscribe to crosshair move events. The callback function is defined in the official Docs |
onTimeRangeMove | TimeRangeChangeEventHandler | Subscribe to time range change events. The callback function is defined in the official Docs |
from | Date | Sets visible range from the specified date. Date object is defined in the official Docs |
to | Date | Sets visible range to the specified date. Date object is defined in the official Docs |
darkTheme | boolean | If true, a custom dark theme palette is applied to the chart |
SeriesObject is an object with the following fields:
options: the series-specific options. Please see the reference for the different serie types:
data: the series data. please refer to the official Docsmarkers: List of Marker to be displayed on the series.priceLines: List of PriceLine to be displayed on the series.legend: the series legend to be displayed on the top-left corner of the chart. The value of the series at the selected time is displayed beside the text legend.linearInterpolation: A number in seconds to auto-fill series data if no data has been provided between two data points for more than the provided time range.kaktana-react-lightweight-charts is released under MIT license. You are free to use, modify and distribute this software, as long as the copyright header is left intact.
FAQs
A simple react wrapper for the tradingview lightweight charts module
We found that @lenicdev/react-lightweight-charts demonstrated a not healthy version release cadence and project activity because the last version was released a year ago. It has 1 open source maintainer collaborating on the project.
Did you know?

Socket for GitHub automatically highlights issues in each pull request and monitors the health of all your open source dependencies. Discover the contents of your packages and block harmful activity before you install or update your dependencies.

Product
Socket’s new Tier 1 Reachability filters out up to 80% of irrelevant CVEs, so security teams can focus on the vulnerabilities that matter.

Research
/Security News
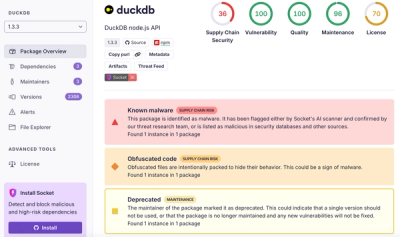
Ongoing npm supply chain attack spreads to DuckDB: multiple packages compromised with the same wallet-drainer malware.

Security News
The MCP Steering Committee has launched the official MCP Registry in preview, a central hub for discovering and publishing MCP servers.