Product
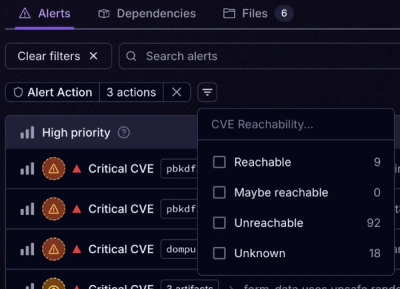
Introducing Tier 1 Reachability: Precision CVE Triage for Enterprise Teams
Socket’s new Tier 1 Reachability filters out up to 80% of irrelevant CVEs, so security teams can focus on the vulnerabilities that matter.
@matteodisabatino/express-prometheus-middleware
Advanced tools
Exposes Prometheus metrics for express applications
Exposes Prometheus metrics for express applications. Based on @trussle/tricorder.
By default, the module exposes information about Prometheus default metrics and the duration and the throughput of each HTTP route that has been called at least once via endpoint /metrics. However, you can customize this behaviour via options.
Since version 1.0.0 the module supports all existing Node.js versions from 6.0.0. express and prom-client are required as peer dependencies.
Since version 3.0.0 the module has got its own official Grafana dashboard. Please note that to have information about usage of CPU and RAM, node_exporter must be used in conjunction.
Since version 4.0.0 the module supports all existing Node.js versions from 14.0.0.
Since version 4.1.0 the module supports all existing Node.js versions from 16.0.0.
Since version 5.0.0 the module supports only Node.js 20 or greater than or equal to 22.
Since version 6.0.0 the module doesn't export garbage collection metrics anymore.
The module is write in TypeScript following the Google TypeScript Style Guide. If you find something not compliant with, please provide a pull request.
In general every pull request that will:
are well accepted.
| Options | Type | Meaning | Default value |
|---|---|---|---|
| collectDefaultMetrics | boolean | Prometheus.DefaultMetricsCollectorConfiguration | Whether or not to collect Prometheus default metrics or configuration for prom-client | true |
| exclude | (req: express.Request): boolean | Avoid all matching routes to expose duration and throughput information | (req) => false |
| excludePaths | string[] | Avoid all matching paths to expose duration and throughput information | [] |
| url | string | The path to which expose metrics | /metrics |
Require the module, instance an object and use the handler as an express middleware.
const express = require('express')
const { ExpressPrometheusMiddleware } = require('@matteodisabatino/express-prometheus-middleware')

const app = express()
const epm = new ExpressPrometheusMiddleware()

app.use(epm.handler)

app.listen(process.env.PORT, () => {
  console.log('Server has been started')
})
You can easily configure your Express Prometheus Middleware instance to ignore specific endpoints in your application.
const express = require('express')
const { ExpressPrometheusMiddleware } = require('@matteodisabatino/express-prometheus-middleware')

const app = express()
const epm = new ExpressPrometheusMiddleware({
  exclude: (req) => req.method === 'POST' && req.path === '/accounts'
  // This setting will prevent to generate the duration and the throughput
  // metrics for route POST /accounts
})

app.use(epm.handler)

app.listen(process.env.PORT, () => {
  console.log('Server has been started')
})
It's likely that you will want to provide additional data to your Prometheus scraper and Express Prometheus Middleware does not get in your way with this:
const express = require('express')
const { ExpressPrometheusMiddleware } = require('@matteodisabatino/express-prometheus-middleware')
// npm install --save prom-client
const Prometheus = require('prom-client')

const app = express()

const gauge = new Prometheus.Gauge({
  name: `myamazingapp_interesting_datapoint`,
  help: `A very helpful but terse explanation of this metric`,
  collect () {
  // Add your own custom logic here
    this.inc();
  },
  // Or more likely
  async collect () {
    const data = SomeRepository.getSomeRecordCounts(...);
    this.set(data.total);
  }
})

app.use(epm.handler)

app.listen(process.env.PORT, () => {
  console.log('Server has been started')
})
Viewing /metrics will then display your data alongside the information provided by this library. See the Prometheus Client documentation for better examples.
FAQs
Exposes Prometheus metrics for express applications
We found that @matteodisabatino/express-prometheus-middleware demonstrated a healthy version release cadence and project activity because the last version was released less than a year ago. It has 1 open source maintainer collaborating on the project.
Did you know?

Socket for GitHub automatically highlights issues in each pull request and monitors the health of all your open source dependencies. Discover the contents of your packages and block harmful activity before you install or update your dependencies.

Product
Socket’s new Tier 1 Reachability filters out up to 80% of irrelevant CVEs, so security teams can focus on the vulnerabilities that matter.

Research
/Security News
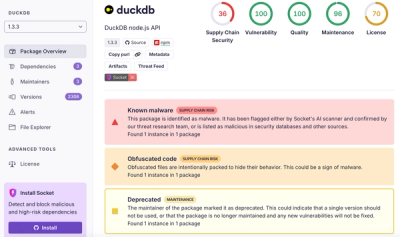
Ongoing npm supply chain attack spreads to DuckDB: multiple packages compromised with the same wallet-drainer malware.

Security News
The MCP Steering Committee has launched the official MCP Registry in preview, a central hub for discovering and publishing MCP servers.