Security News
Crates.io Users Targeted by Phishing Emails
The Rust Security Response WG is warning of phishing emails from rustfoundation.dev targeting crates.io users.
@opentelemetry/host-metrics
Advanced tools
@opentelemetry/host-metrics is a package that provides metrics related to the host system, such as CPU and memory usage. It is part of the OpenTelemetry project, which is a set of APIs, libraries, agents, and instrumentation to provide observability for cloud-native software.
Collect CPU Usage Metrics
This feature allows you to collect CPU usage metrics from the host system. The code sample demonstrates how to initialize the HostMetrics class and start collecting metrics using a MeterProvider.
const { HostMetrics } = require('@opentelemetry/host-metrics');
const { MeterProvider } = require('@opentelemetry/sdk-metrics-base');
const meterProvider = new MeterProvider();
const hostMetrics = new HostMetrics({ meterProvider });
hostMetrics.start();
// The metrics will be collected and can be exported using an exporter.Collect Memory Usage Metrics
This feature allows you to collect memory usage metrics from the host system. The code sample shows how to set up the HostMetrics to start collecting memory metrics using a MeterProvider.
const { HostMetrics } = require('@opentelemetry/host-metrics');
const { MeterProvider } = require('@opentelemetry/sdk-metrics-base');

const meterProvider = new MeterProvider();
const hostMetrics = new HostMetrics({ meterProvider });

hostMetrics.start();

// Memory usage metrics will be collected and can be exported using an exporter.prom-client is a Prometheus client for Node.js that can be used to collect various metrics, including host metrics. It provides a flexible way to define custom metrics and export them to a Prometheus server. Compared to @opentelemetry/host-metrics, prom-client is more focused on integration with Prometheus and offers a broader range of metric types.
node-os-utils is a utility library for Node.js that provides functions to get system and OS-related metrics, such as CPU, memory, and disk usage. It is simpler and more lightweight compared to @opentelemetry/host-metrics, but it does not integrate with the OpenTelemetry ecosystem for observability.
This module provides automatic collection of Host Metrics which includes metrics for:
Compatible with OpenTelemetry JS API and SDK 1.0+.
npm install --save @opentelemetry/host-metrics
const { MeterProvider } = require('@opentelemetry/sdk-metrics');
const { HostMetrics } = require('@opentelemetry/host-metrics');
const { PrometheusExporter } = require('@opentelemetry/exporter-prometheus');

const exporter = new PrometheusExporter(
  {
    startServer: true
  }, () => {
    console.log('prometheus scrape endpoint: http://localhost:9464/metrics')
  }
);

const meterProvider = new MeterProvider({
  readers: [reader],
});

const hostMetrics = new HostMetrics({ meterProvider });
hostMetrics.start();
This package uses Semantic Conventions Version 1.25.0.
As for now the Semantic Conventions are bundled in this package but eventually will be imported from @opentelemetry/semantic-conventions package when it is updated to latest version.
Ref: opentelemetry-js/issues/4235
Metrics collected:
| Metric | Short Description |
|---|---|
system.cpu.time | Seconds each logical CPU spent on each mode |
system.cpu.utilization | CPU usage time (0-1) |
system.memory.usage | Reports memory in use by state |
system.memory.utilization | Memory usage (0-1) |
system.network.dropped | Count of packets that are dropped |
system.network.errors | Count of network errors detected |
system.network.io | Network flow direction |
process.cpu.time | Total CPU seconds |
process.cpu.utilization | Difference in process.cpu.time since the last measurement |
process.memory.usage | The amount of physical memory in use |
Attributes collected:
| Metric | Short Description |
|---|---|
system.cpu.logical_number | The logical CPU number |
system.cpu.state | The state of the CPU |
system.memory.state | The memory state |
system.device | The device identifier |
network.io.direction | The network IO operation direction |
system.network.state | The network state |
process.cpu.state | The CPU state |
APACHE 2.0 - See LICENSE for more information.
FAQs
OpenTelemetry Host Metrics for Node.js
The npm package @opentelemetry/host-metrics receives a total of 181,521 weekly downloads. As such, @opentelemetry/host-metrics popularity was classified as popular.
We found that @opentelemetry/host-metrics demonstrated a healthy version release cadence and project activity because the last version was released less than a year ago. It has 3 open source maintainers collaborating on the project.
Did you know?

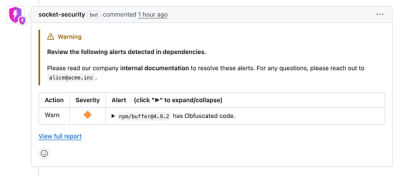
Socket for GitHub automatically highlights issues in each pull request and monitors the health of all your open source dependencies. Discover the contents of your packages and block harmful activity before you install or update your dependencies.

Security News
The Rust Security Response WG is warning of phishing emails from rustfoundation.dev targeting crates.io users.

Product
Socket now lets you customize pull request alert headers, helping security teams share clear guidance right in PRs to speed reviews and reduce back-and-forth.

Product
Socket's Rust support is moving to Beta: all users can scan Cargo projects and generate SBOMs, including Cargo.toml-only crates, with Rust-aware supply chain checks.