Research
Malicious fezbox npm Package Steals Browser Passwords from Cookies via Innovative QR Code Steganographic Technique
A malicious package uses a QR code as steganography in an innovative technique.
@paulirish/trace_engine
Advanced tools
This folder contains the new trace engine that was first implemented for the Performance Insights panel and is now being repurposed as the primary trace engine that we use within DevTools.
This folder contains the new trace engine that was first implemented for the Performance Insights panel and is now being repurposed as the primary trace engine that we use within DevTools.
import * as TraceModel from '@paulirish/trace_engine';
polyfillDOMRect();
const processor = TraceModel.Processor.TraceProcessor.createWithAllHandlers();
await processor.parse(traceEvents);
console.log(processor.data)
Note: in reality to run in Node, you'll need to polyfill window.DOMRect. 😜
See the included analyze-trace.mjs a runnable invocation.
See also http://go/btlax
# build bundle with esbuild
scripts/trace/build-trace-engine-lib.sh

# run
node scripts/trace/analyze-trace.mjs test/unittests/fixtures/traces/web-dev.json.gz

# test
node scripts/trace/test/test-trace-engine.mjs

# copy built files to $HOME/code/trace_engine
scripts/trace/copy-build-trace-engine-for-publish.sh
# switch to standalone
cd $HOME/code/trace_engine

# test
node test/test-trace-engine.mjs

# bump and publish
npm version v0.0.XXX   # Manually determine next version
npm publish --access public --dry-run
npm publish --access public
     ┌──────────────┐
     │  Model#parse ├───┐
     └──────────────┘   │
                        │
             ┌──────────▼──────────┐
             │async processor#parse│
             └──────────┬──────────┘
                        │
             ┌──────────▼────────────┐
             │for handler of handlers│
             └───┬────────────────┬──┘
                 │                │
┌────────────────▼────┐     ┌─────▼────────────────┐
│NetworkRequestHandler│     │...many more handlers │
│                     │     │                      │
│     reset()         │     │                      │
│     initialize()    │     │                      │
│                     │     │                      │
│     handleEvent()   │     │                      │
│                     │     │                      │
│     finalize()      │     │                      │
│                     │     │                      │
│     data()          │  │  │                      │
└─────────────────────┘  │  └──────────────────────┘
                         │
                         │
      ┌──────────────────▼─────────────────┐
      │const data = model.traceParsedData()│
      └────────────────────────────────────┘
Model#parse is the entrypoint into the engine and is the public interface that consumers use to initiate tracing and to fetch data back.
All the processing is done by the Processor. The processor contains a series of Handlers, each of which is responsible for parsing events of a particular category.
The trace processor loops over every event in the trace and calls each handler in turn (done this way so we only loop over the trace file once, rather than doing it once-per-handler). A Handler is a file that exposes a set of methods, most importantly handleEvent() and data(). The handleEvent function will be called for each event in the trace, and it is up to an individual handler to do something with that event if it needs to. The data method should return the final data that has been parsed and generated by the handler.
Once processing is done (read on for more details on how to track this), you can use the traceParsedData() method to fetch the result of parsing a given trace.
At the time of writing (06 June 2023) we are midway through a migration of the Performanc Panel's trace engine from the SDK.TracingModel to the new TraceEngine. Consequently, not all of the TraceEngine's handlers are currently active, because we don't want to run expensive handlers whose data we do not yet use in the UI.
Therefore, to create a model instance, we use Model.createWithRequiredHandlersForMigration(), which initializes a model configured correctly with the right handlers.
Once the migration is done, we can swap to Model.createWithAllHandlers() and remove the code that enables a subset of the handlers to run.
If you want to strictly control the set of handlers that are run (for example, if you only want to run one particular handler), you can initialize the model yourself and pass in the set of handlers:
const model = new Model({
  NetworkRequestHandler: Handlers.ModelHandlers.NetworkRequestHandler,
})
Once you have an instance of the model, you can call the parse method to take a set of raw events and parse them. Once parsed, you then have to call the traceParsedData method, providing an index of the trace you want to have the data for. This is because any model can store a number of traces. Each trace is given an index, which starts at 0 and increments by one as a new trace is parsed.
If you are managing multiple traces, you should store them in some form of indexed data structure so you can easily know which index to use to fetch any data from the model. You may delete a trace with deleteTraceByIndex, which will then update the indexes of all other traces too.
If you need to check how many traces you have, you can call model.size(). The latest trace's index is therefore always model.size() - 1.
When you call parse you have two options. You can await it, which will wait until the trace is fully parsed:
await this.model.parse();
But it's likely preferable to instead use events, to avoid blocking the UI whilst parsing is in progress. You can listen to the ModelUpdateEvent for updates:
this.model.addEventListener(Model.ModelUpdateEvent.eventName, event => {
  const {data} = event as Model.ModelUpdateEvent;

  if (data.data === 'done') {
    // trace is complete
    const newestData = this.model.traceParsedData(this.model.size() - 1);
  } else {
    // data.data will be an object: { index: X, total: Y}, which represents how many events (X) have been processed out of a total (Y).
    // This can be used to show a progress bar, for example.
  }
})
The object returned from traceParsedData() is an object of key-value pairs where each key is the name of a handler, and the value is the data that was parsed and returned from that handler.
{
  NetworkRequestHandler: ReturnType<typeof NetworkRequestHandler['data']>,
  LayoutShiftHandler: ReturnType<typeof LayoutShiftHandler['data']>,
  // and so on for each enabled Handler
}
FAQs
This package contains the trace engine implementation used by the DevTools Performance Panel.
The npm package @paulirish/trace_engine receives a total of 754,337 weekly downloads. As such, @paulirish/trace_engine popularity was classified as popular.
We found that @paulirish/trace_engine demonstrated a healthy version release cadence and project activity because the last version was released less than a year ago. It has 2 open source maintainers collaborating on the project.
Did you know?

Socket for GitHub automatically highlights issues in each pull request and monitors the health of all your open source dependencies. Discover the contents of your packages and block harmful activity before you install or update your dependencies.

Research
A malicious package uses a QR code as steganography in an innovative technique.

Research
/Security News
Socket identified 80 fake candidates targeting engineering roles, including suspected North Korean operators, exposing the new reality of hiring as a security function.

Application Security
/Research
/Security News
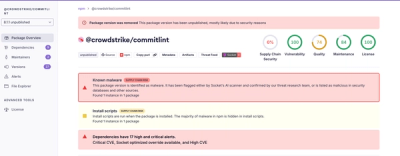
Socket detected multiple compromised CrowdStrike npm packages, continuing the "Shai-Hulud" supply chain attack that has now impacted nearly 500 packages.