Product
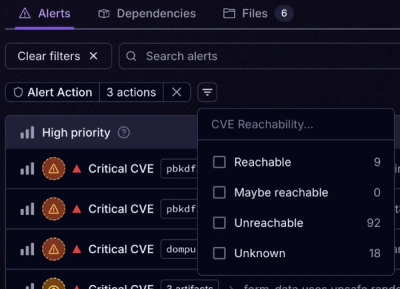
Introducing Tier 1 Reachability: Precision CVE Triage for Enterprise Teams
Socket’s new Tier 1 Reachability filters out up to 80% of irrelevant CVEs, so security teams can focus on the vulnerabilities that matter.
@push-based/eslint-stats
Advanced tools
The @push-based/eslint-stats package provides tools and utilities for collecting, and analyzing ESLint timing
profiles.
Measure, sort, filter, print, voilà.
To create ESLint output you just execute it
npx eslint .
This generates the following output:
/Users/user/project/path/to/e2e-setup.ts
  42:28  warning  '_' is defined but never used  @typescript-eslint/no-unused-vars

/Users/user/project/path/to/process.ts
  200:3  error  Expected an assignment or function call and instead saw an expression  @typescript-eslint/no-unused-expressions
  41:25  warning  Unexpected any. Specify a different type  @typescript-eslint/no-explicit-any
  214:5  error  Definition for rule 'functional/no-let' was not found                  functional/no-let

✖ 38 problems (8 errors, 30 warnings)
  0 errors and 3 warnings potentially fixable with the `--fix` option.
The top part is a listing of all files and its issues, followed by a summary of the total number of problems found, including errors and warnings.
To analyze your ESLint performance, you first need to generate a statistics file. You can do this by running ESLint with
the --stats flag and formatting the output as JSON.
# Options:
# Output:
#   `-o`, `--output-file` path::String   Specify file to write report to
#   `-f`, `--format` String              Use a specific output format - default: stylish
# Miscellaneous:
#  `--stats`                          Add statistics to the lint report - default: false
#  `--format` String              Use a specific output format - default: stylish
# $ command [...args] -o <file-path> -f json --stats
npx eslint . -o eslint-stats.json -f json --stats
You can add an environment variable to use eslints native printing to see [N] results in the terminal. And optionally, skip the output file and use the native printing.
# Environment:
# `TIMING` Number  Prints aggregated rule timing stats in the terminal - default: 10
# $ENV_VAR command [...args] --stats
TIMING=true npx eslint . --stats
TIMING=10 npx eslint . --stats
TIMING=all npx eslint . --stats
npm install @push-based/eslint-stats
This guide provides instructions for using the @push-based/eslint-stats CLI.
measure commandUsage:
npx @push-based/eslint-stats measure [args...] [options...]
Description: Runs ESLint on a given set of files and measures timing stats. This command is a wrapper around the ESLint CLI, adding the ability to capture timing statistics.
Arguments:
| Argument | Type | Description |
|---|---|---|
[args...] | string[] | Arguments for ESLint, e.g., files, globs, or commands like nx run my-app:lint. If omitted, ESLint runs on the current directory. |
ESLint Options:
| Option | Alias | Type | Description |
|---|---|---|---|
--config | -c | string | Path to the ESLint config file. |
--output-file | -o | string | File to write the ESLint output to. |
Stats Options:
| Option | Type | Default | Description |
|---|---|---|---|
--report-path | string | File to write the stats to. | |
--show | boolean | true | Show the stats report after running the command. |
--interactive | boolean | true | Show the stats report as an interactive table. |
Examples:
eslint-stats measure "src/**/*.ts" - Lint all TypeScript files in the src directory.eslint-stats measure "src/**/*.ts" --config ./.eslintrc.ci.js --output-file eslint-report.json - Lint files with a
specific config and output file.eslint-stats measure "src/**/*.ts" --file-output stats.json - Lint files and save performance statistics to
stats.json.eslint-stats measure nx run project-name:lint - Lint files using a command.analyse commandUsage:
npx @push-based/eslint-stats analyse <file> [options...]
Description: Analyzes an ESLint statistics JSON file to provide insights into rule performance and violation counts. It can display the results in the console or save them to a Markdown file. An interactive mode is available for a more dynamic analysis experience.
Arguments:
| Argument | Type | Description |
|---|---|---|
<file> | string | Path to the ESLint stats JSON file |
Options:
| Option | Alias | Type | Default | Description |
|---|---|---|---|---|
--groupBy | -g | string | rule | Group by "rule", "file", or "file-rule". Choices: rule, file, file-rule. |
--sortBy | -s | string | time | Sort by "time" or "violations". Choices: time, violations. |
--sortDirection | -d | string | desc | Sort direction "asc" or "desc". Choices: asc, desc. |
--take | -t | array | The number of entries to display. For file-rule group, two values can be provided for files and rules. | |
--outPath | string | Path to the output file. Defaults to the input file name with a .md extension. | ||
--interactive | boolean | true (if TTY) | Interactive mode to dynamically explore the performance data. |
Examples:
eslint-stats analyse ./eslint-stats.json - Analyze the stats file with default options.eslint-stats analyse ./eslint-stats.json --groupBy file - Group the statistics by file.eslint-stats analyse ./eslint-stats.json --sortBy violations - Sort the results by the number of violations.eslint-stats analyse ./eslint-stats.json --groupBy file-rule --take 5 3 - Display only the top 5 files and top 3
files and 3 rules.eslint-stats analyse ./eslint-stats.json --outPath ./performance-report.md - Save the analysis to a Markdown file.When you run the analyse command in an interactive terminal, it will start in interactive mode by default. This mode
allows you to change the grouping, sorting, and other options on the fly by pressing keys, providing a powerful way to
explore your ESLint performance data without re-running the command multiple times.
📊 Total: 📁 52 files • ⚙️ 3224 rules • ⚡ 278.63ms (parse: 110.65ms, rules: 89.00ms, fix: 0.00ms, other: 78.98ms) 🚨 7 errors • ⚠️ 21 warnings • 🔧 6 fixable
←/→ - Sort ←/→: time or violations↑/↓ - Order ↑/↓: asc or desc+/- - Rows: 10 (File or Rule) or 5 3 (File and Rule)
F/R - F:10, R:10: File or RuleTab - Group: rule or file or file-ruleEnter - Write to report-output: <eslint-stats-file-name>.mdCtrl+C - Quit: Ctrl+CThe table view is a dynamic view of the stats data. It is updated in real-time as you change the options. The data is color graded, and ensiched with small ascii charts.
| 📁 File → ⚙️ Rule | 📁 File | ⚙️ Rule |
|---|---|---|
 |  |  |
When you hit the enter key, the current stta is sent to a mark-down file. This is useful to share findings with your team.
| 📁 File → ⚙️ Rule | ⚡ Time ↓ | % ↓ | 🚨 Errors | ⚠️ Warnings |
|---|---|---|---|---|
| .../eslint-stats/eslint.config.mjs | ▄▂▁▃ 20.57 ms | 7.4% | 0 | 0 |
| - @typescript-eslint/no-unused-vars | 2.03 ms | 9.9% | 0 | 0 |
| - @typescript-eslint/triple-slash-reference | 0.20 ms | 1.0% | 0 | 0 |
| .../bin/eslint-stats-command.integration.test.ts | ▄▄▁▂ 18.36 ms | 6.6% | 1 | 1 |
| - @nx/enforce-module-boundaries | 4.87 ms | 26.5% | 1 | 0 |
| - @typescript-eslint/no-unused-vars | 1.35 ms | 7.4% | 0 | 1 |
| .../stats/eslint-stats-table.ts | ▅▂▁▂ 17.15 ms | 6.2% | 2 | 0 |
| - @typescript-eslint/no-unused-vars | 1.21 ms | 7.0% | 0 | 0 |
| - @nx/enforce-module-boundaries | 0.75 ms | 4.4% | 0 | 0 |
| .../eslint-stats/package.json | ▁▇▁▁ 15.76 ms | 5.7% | 2 | 0 |
| - @nx/dependency-checks | 13.56 ms | 86.0% | 2 | 0 |
| .../analyse/interactive.ts | ▅▂▁▂ 14.72 ms | 5.3% | 0 | 6 |
| - @typescript-eslint/no-unused-vars | 1.21 ms | 8.2% | 0 | 4 |
| - @nx/enforce-module-boundaries | 1.07 ms | 7.2% | 0 | 2 |
Group: Rule
⚙️ 3224 rules • ⚡ 89.00ms 🚨 7 errors • ⚠️ 21 warnings • 🔧 6 fixable
Group: File
📁 52 files • ⚡ 278.63ms ▄▂▁▃ (parse: 110.65ms, rules: 89.00ms, fix: 0.00ms, other: 78.98ms) 🚨 7 errors • ⚠️ 21 warnings • 🔧 6 fixable
Group: File->Rule
📁 52 files • ⚙️ 3224 rules • ⚡ 278.63ms ▄▂▁▃ (parse: 110.65ms, rules: 89.00ms, fix: 0.00ms, other: 78.98ms) 🚨 7 errors • ⚠️ 21 warnings • 🔧 6 fixable
FAQs
---
We found that @push-based/eslint-stats demonstrated a healthy version release cadence and project activity because the last version was released less than a year ago. It has 2 open source maintainers collaborating on the project.
Did you know?

Socket for GitHub automatically highlights issues in each pull request and monitors the health of all your open source dependencies. Discover the contents of your packages and block harmful activity before you install or update your dependencies.

Product
Socket’s new Tier 1 Reachability filters out up to 80% of irrelevant CVEs, so security teams can focus on the vulnerabilities that matter.

Research
/Security News
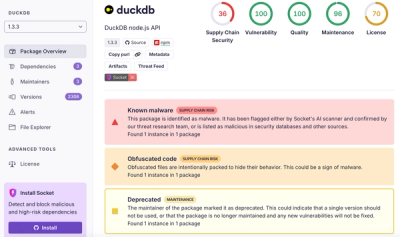
Ongoing npm supply chain attack spreads to DuckDB: multiple packages compromised with the same wallet-drainer malware.

Security News
The MCP Steering Committee has launched the official MCP Registry in preview, a central hub for discovering and publishing MCP servers.