Security News
Package Maintainers Call for Improvements to GitHub’s New npm Security Plan
Maintainers back GitHub’s npm security overhaul but raise concerns about CI/CD workflows, enterprise support, and token management.
@sentry/ember
Advanced tools
This package is an Ember addon that wraps @sentry/browser, with added functionality related to Ember. All methods available in
@sentry/browser can be imported from @sentry/ember.
As with other Ember addons, run:
ember install @sentry/ember
Then add the following config to config/environment.js
  ENV['@sentry/ember'] = {
    sentry: {
      dsn: '__DSN__' // replace __DSN__ with your DSN,
      tracesSampleRate: 1.0, // Be sure to lower this for your production environment
    }
  };
To use this SDK, call InitSentryForEmber before the application is initialized, in app.js. This will load Sentry config from environment.js for you.
import Application from '@ember/application';
import Resolver from 'ember-resolver';
import loadInitializers from 'ember-load-initializers';
import config from './config/environment';
import { InitSentryForEmber } from '@sentry/ember';

InitSentryForEmber();

export default class App extends Application {
  modulePrefix = config.modulePrefix;
  podModulePrefix = config.podModulePrefix;
  Resolver = Resolver;
}
Aside from configuration passed from this addon into @sentry/browser via the sentry property, there is also the following Ember specific configuration.
  ENV['@sentry/ember'] = {
    ignoreEmberOnErrorWarning: false, // Will silence Ember.onError warning without the need of using Ember debugging tools. False by default.
    sentry: ... // See sentry-javascript configuration https://docs.sentry.io/error-reporting/configuration/?platform=javascript
  };
@sentry/ember captures performance by default, if you would like to disable the automatic performance instrumentation, you can add the following to your config/environment.js:
  ENV['@sentry/ember'] = {
    disablePerformance: true, // Will disable automatic instrumentation of performance. Manual instrumentation will still be sent.
    sentry: ... // See sentry-javascript configuration https://docs.sentry.io/error-reporting/configuration/?platform=javascript
  };
If you would like to capture beforeModel, model, afterModel and setupController times for one of your routes,
you can import instrumentRoutePerformance and wrap your route with it.
import Route from '@ember/routing/route';
import { instrumentRoutePerformance } from '@sentry/ember';

class MyRoute extends Route {
  model() {
    //...
  }
}

export default instrumentRoutePerformance(MyRoute);
The runloop queue durations are instrumented by default, as long as they are longer than a threshold (by default 5ms). This helps (via the render queue) capturing the entire render in case component render times aren't fully instrumented, such as when using glimmer components.
If you would like to change the runloop queue threshold, add the following to your config:
  ENV['@sentry/ember'] = {
    minimumRunloopQueueDuration: 0, // All runloop queue durations will be added as spans.
  };
Non-glimmer component render times will automatically get captured.
If you would like to disable component render being instrumented, add the following to your config:
  ENV['@sentry/ember'] = {
    disableInstrumentComponents: true, // Will disable automatic instrumentation for components.
  };
Additionally, components whose render time is below a threshold (by default 2ms) will not be included as spans. If you would like to change this threshold, add the following to your config:
  ENV['@sentry/ember'] = {
    minimumComponentRenderDuration: 0, // All (non-glimmer) component render durations will be added as spans.
  };
Currently glimmer component render durations can only be captured indirectly via the runloop instrumentation. You can optionally enable a setting to show component definitions (which will indicate which components are being rendered) be adding the following to your config:
  ENV['@sentry/ember'] = {
    enableComponentDefinition: true, // All component definitions will be added as spans.
  };
@sentry/ember currently supports Ember 3.8+ for error monitoring.
Previously we've recommended using the Ember integration from @sentry/integrations but moving forward we will be using
this Ember addon to offer more Ember-specific error and performancing monitoring.
You can find example instrumentation in the dummy application, which is also used for testing. To test with the dummy
application, you must pass the dsn as an environment variable.
SENTRY_DSN=__DSN__ ember serve
FAQs
Official Sentry SDK for Ember.js
The npm package @sentry/ember receives a total of 14,960 weekly downloads. As such, @sentry/ember popularity was classified as popular.
We found that @sentry/ember demonstrated a healthy version release cadence and project activity because the last version was released less than a year ago. It has 10 open source maintainers collaborating on the project.
Did you know?

Socket for GitHub automatically highlights issues in each pull request and monitors the health of all your open source dependencies. Discover the contents of your packages and block harmful activity before you install or update your dependencies.

Security News
Maintainers back GitHub’s npm security overhaul but raise concerns about CI/CD workflows, enterprise support, and token management.

Product
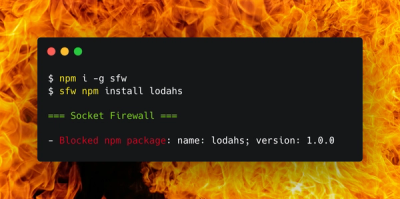
Socket Firewall is a free tool that blocks malicious packages at install time, giving developers proactive protection against rising supply chain attacks.

Research
Socket uncovers malicious Rust crates impersonating fast_log to steal Solana and Ethereum wallet keys from source code.