Research
Security News
Lazarus Strikes npm Again with New Wave of Malicious Packages
The Socket Research Team has discovered six new malicious npm packages linked to North Korea’s Lazarus Group, designed to steal credentials and deploy backdoors.
@steelbreeze/landscape
Advanced tools
Landscape map visualisation of data.
 These visualisations conform to the Archimate Landscape Map Viewpoint.
The tool takes as an input data set of the portfolio and dimensions they are associated with; it then can determine the optimal sequence of the values on the dimensions you select for the x and y axis for the optimal layout. It then generates the layout, splitting a cell in the table if multiple items in the portfolio are mapped to it, and joining items in neighbouring cells.
These visualisations are an invaluable communication tool offering insight into the health of an application portfolio. High density areas indicate a fragmented portfolio, or redundancy; a wide scope may indicate over-extension.
If you like @steelbreeze/landscape, please star it.
Download landscape.min.js from the Releases page. Once added into your project, the API will be available under the landscape global object.
The API is split into four main functions:
Depending on your needs, you use a subset of these functions. For example, if you know the axes you want to display, you can omit step 1; if you know the sequence you'd like the axes displayed in, omit step 2; if you wish to render your own HTML or SVG in D3 or similar, you can omit step 5.
The full API documentation can be found here.
MIT License
Copyright (c) 2020 David Mesquita-Morris
FAQs
Landscape map viewpoint visualisation
We found that @steelbreeze/landscape demonstrated a not healthy version release cadence and project activity because the last version was released a year ago. It has 1 open source maintainer collaborating on the project.
Did you know?

Socket for GitHub automatically highlights issues in each pull request and monitors the health of all your open source dependencies. Discover the contents of your packages and block harmful activity before you install or update your dependencies.

Research
Security News
The Socket Research Team has discovered six new malicious npm packages linked to North Korea’s Lazarus Group, designed to steal credentials and deploy backdoors.

Security News
Socket CEO Feross Aboukhadijeh discusses the open web, open source security, and how Socket tackles software supply chain attacks on The Pair Program podcast.

Security News
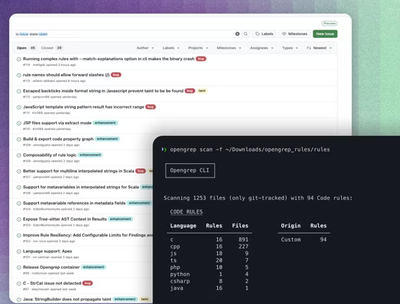
Opengrep continues building momentum with the alpha release of its Playground tool, demonstrating the project's rapid evolution just two months after its initial launch.