Research
Security News
Lazarus Strikes npm Again with New Wave of Malicious Packages
The Socket Research Team has discovered six new malicious npm packages linked to North Korea’s Lazarus Group, designed to steal credentials and deploy backdoors.
@syncfusion/ej2-maps
Advanced tools
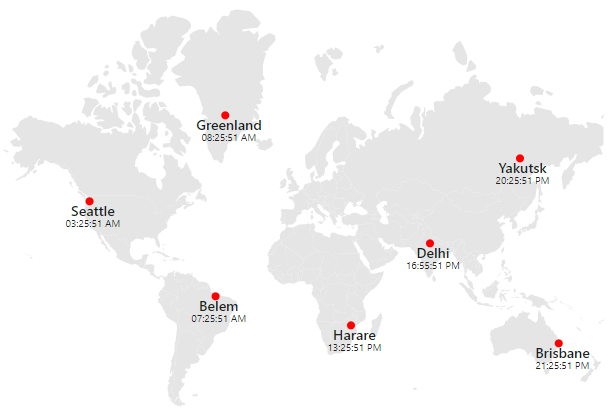
The Maps component is used to visualize the geographical data and represent the statistical data of a particular geographical area on earth with user interactivity, and provides various customizing options
The JavaScript Maps control is used to visualize geographical data and represent statistical data of a specific geographical area on earth with user interactivity, and it provides a wide range of customization options.
Getting started . Online demos . Learn more

Trusted by the world's leading companies

To install the Maps and its dependent packages, use the following command.
npm install @syncfusion/ej2-maps
Maps control is also offered in the following list of frameworks.
 Angular |  React |  Vue |  ASP.NET Core |  ASP.NET MVC |
|---|
Product support is available through the following mediums.
Check the changelog here. Get minor improvements and bug fixes every week to stay up to date with frequent updates.
This is a commercial product and requires a paid license for possession or use. Syncfusion’s licensed software, including this control, is subject to the terms and conditions of Syncfusion's EULA. To acquire a license for 80+ JavaScript UI controls, you can purchase or start a free 30-day trial.
A free community license is also available for companies and individuals whose organizations have less than $1 million USD in annual gross revenue and five or fewer developers.
See LICENSE FILE for more info.
© Copyright 2023 Syncfusion, Inc. All Rights Reserved. The Syncfusion Essential Studio license and copyright applies to this distribution.
FAQs
The Maps component is used to visualize the geographical data and represent the statistical data of a particular geographical area on earth with user interactivity, and provides various customizing options
The npm package @syncfusion/ej2-maps receives a total of 10,036 weekly downloads. As such, @syncfusion/ej2-maps popularity was classified as popular.
We found that @syncfusion/ej2-maps demonstrated a healthy version release cadence and project activity because the last version was released less than a year ago. It has 0 open source maintainers collaborating on the project.
Did you know?

Socket for GitHub automatically highlights issues in each pull request and monitors the health of all your open source dependencies. Discover the contents of your packages and block harmful activity before you install or update your dependencies.

Research
Security News
The Socket Research Team has discovered six new malicious npm packages linked to North Korea’s Lazarus Group, designed to steal credentials and deploy backdoors.

Security News
Socket CEO Feross Aboukhadijeh discusses the open web, open source security, and how Socket tackles software supply chain attacks on The Pair Program podcast.

Security News
Opengrep continues building momentum with the alpha release of its Playground tool, demonstrating the project's rapid evolution just two months after its initial launch.