
react-native-echarts-wrapper v2.0.0


Screenshots •
How To Use •
Authors
A React Native wrapper for the popular echarts charting framework. With this library you can create complex, interactive charts with great performance on mobile devices.
The fact that the charting framework purely runs in a webview makes it very stable to upcomming React-Native versions. On the other hand it is not easy to make a two way data communication between the chart (running in the webview Javascript thread) and the React-Native Javascript thread. With this library you can even build the more complex chart options of echarts. You can inject custom javascript code within the webview which allows you to access the chart api (detect taps, selections etc...)
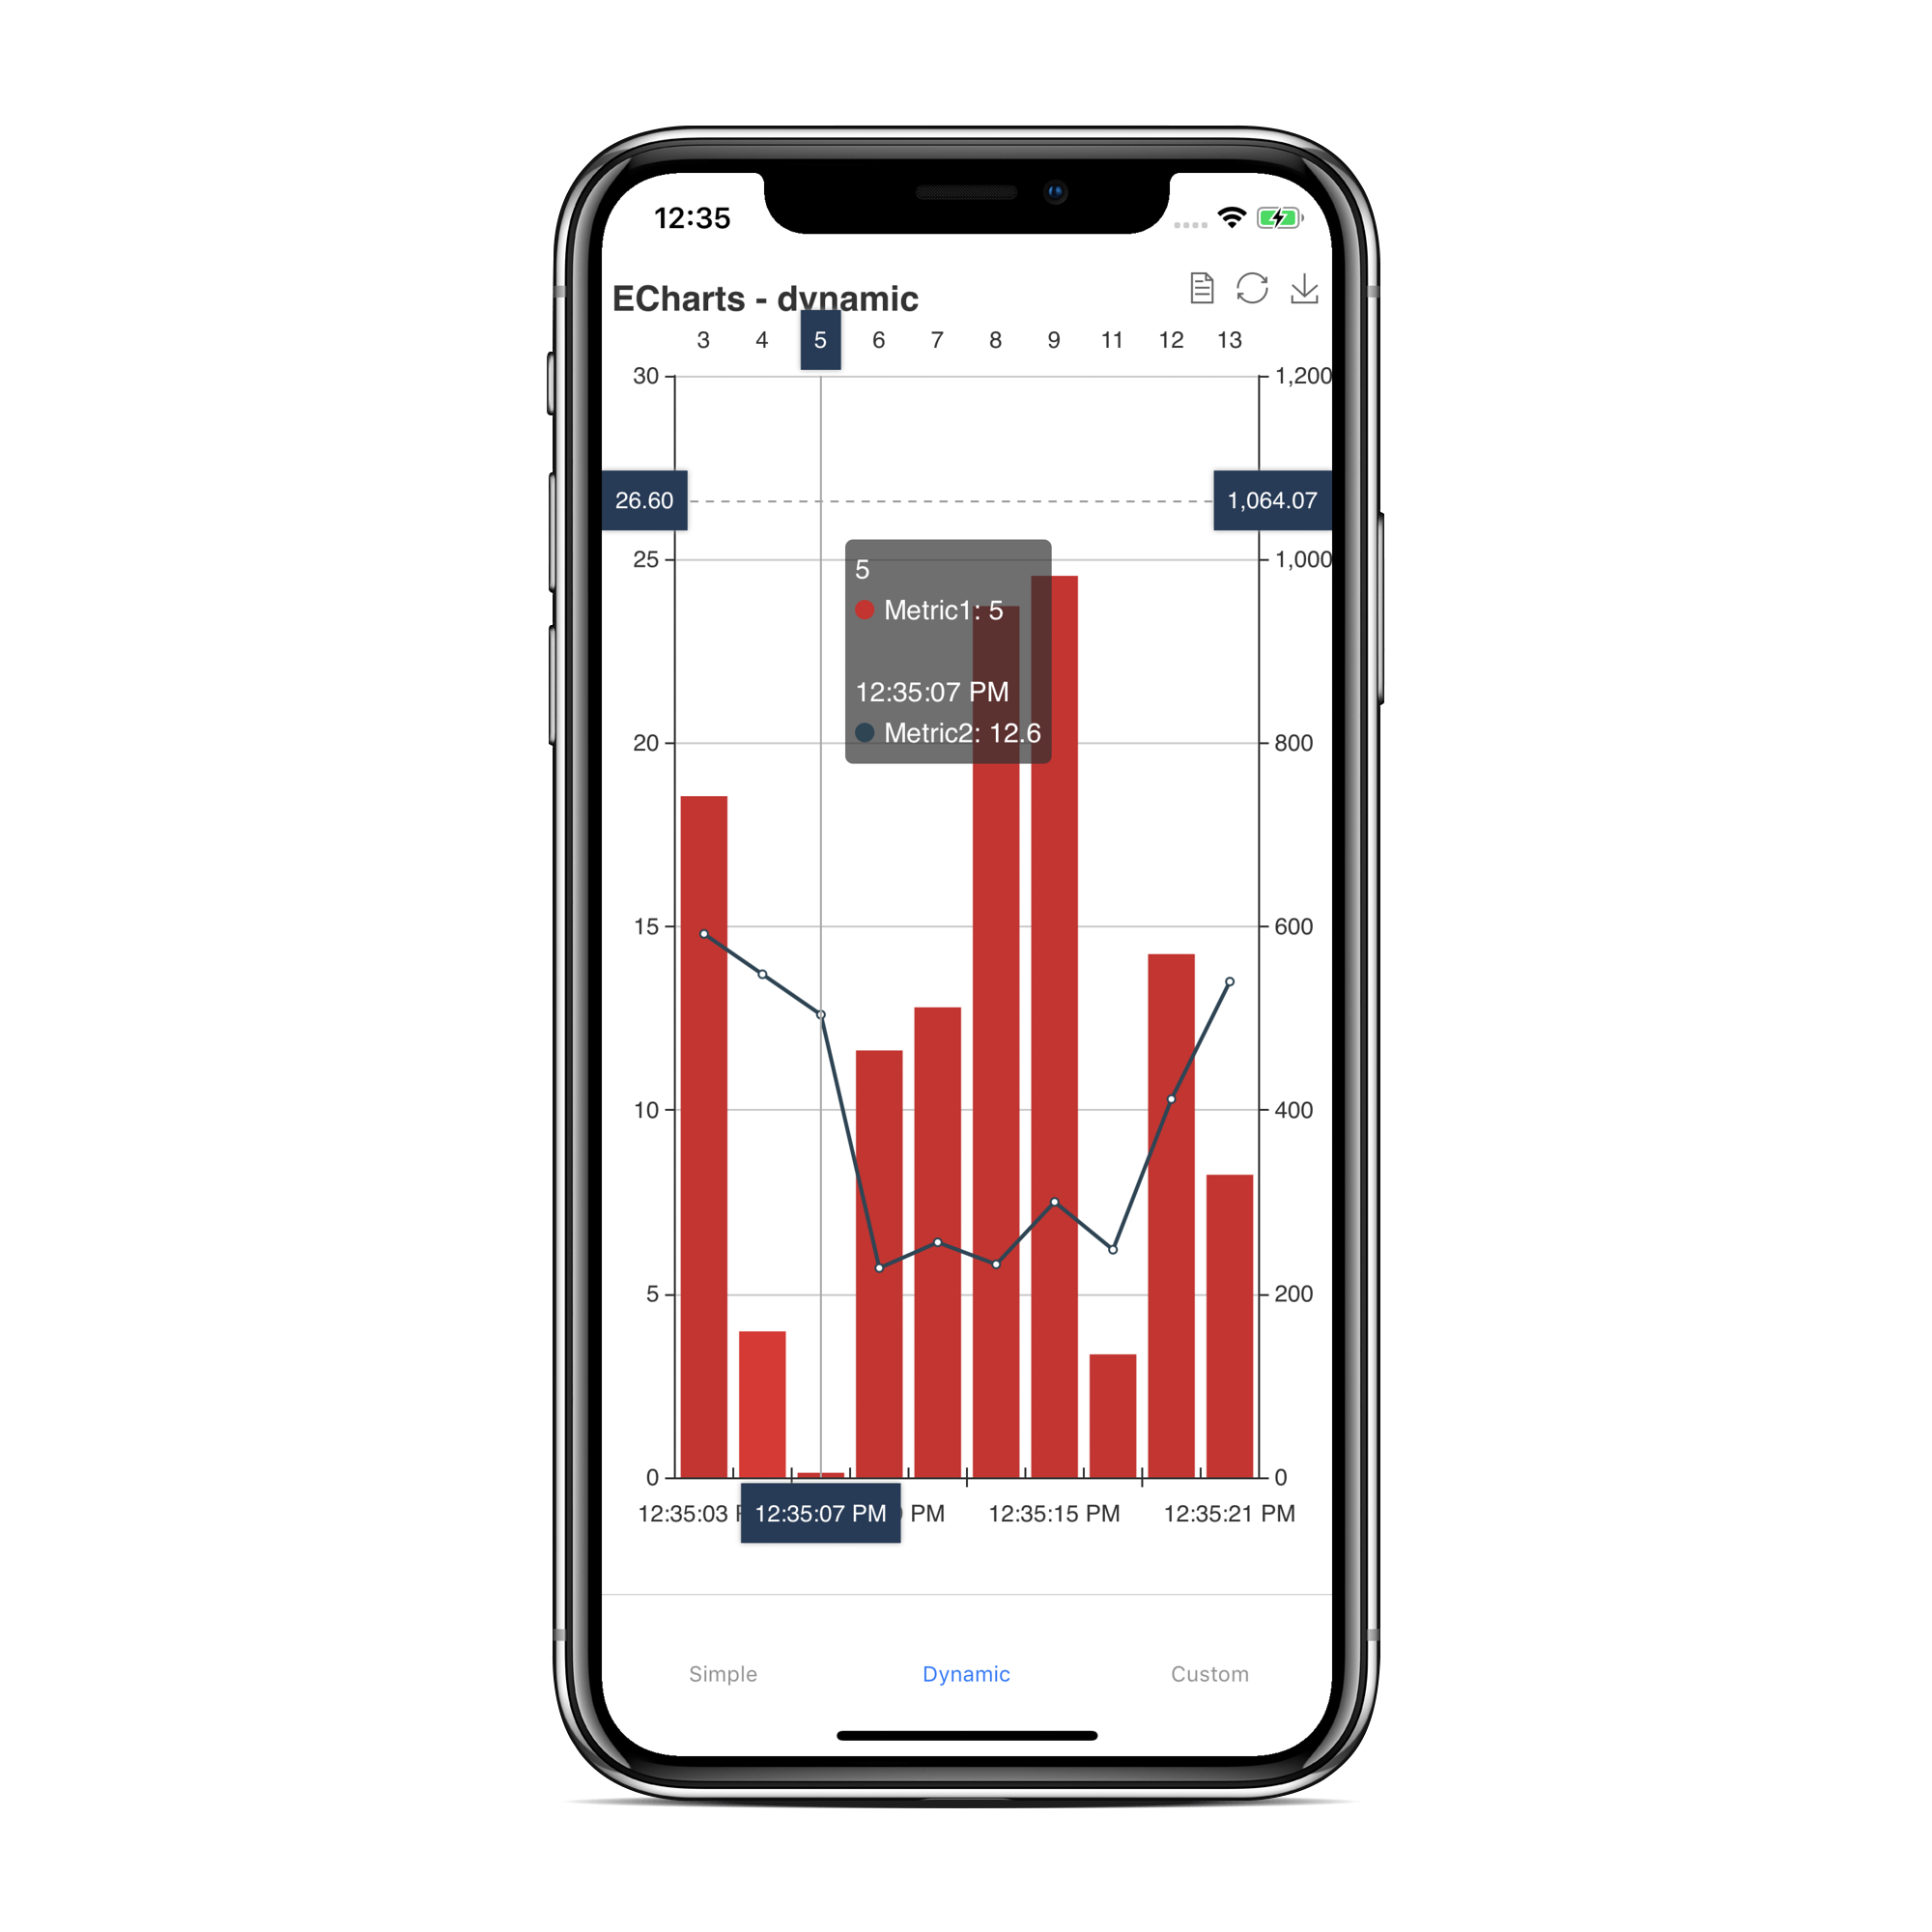
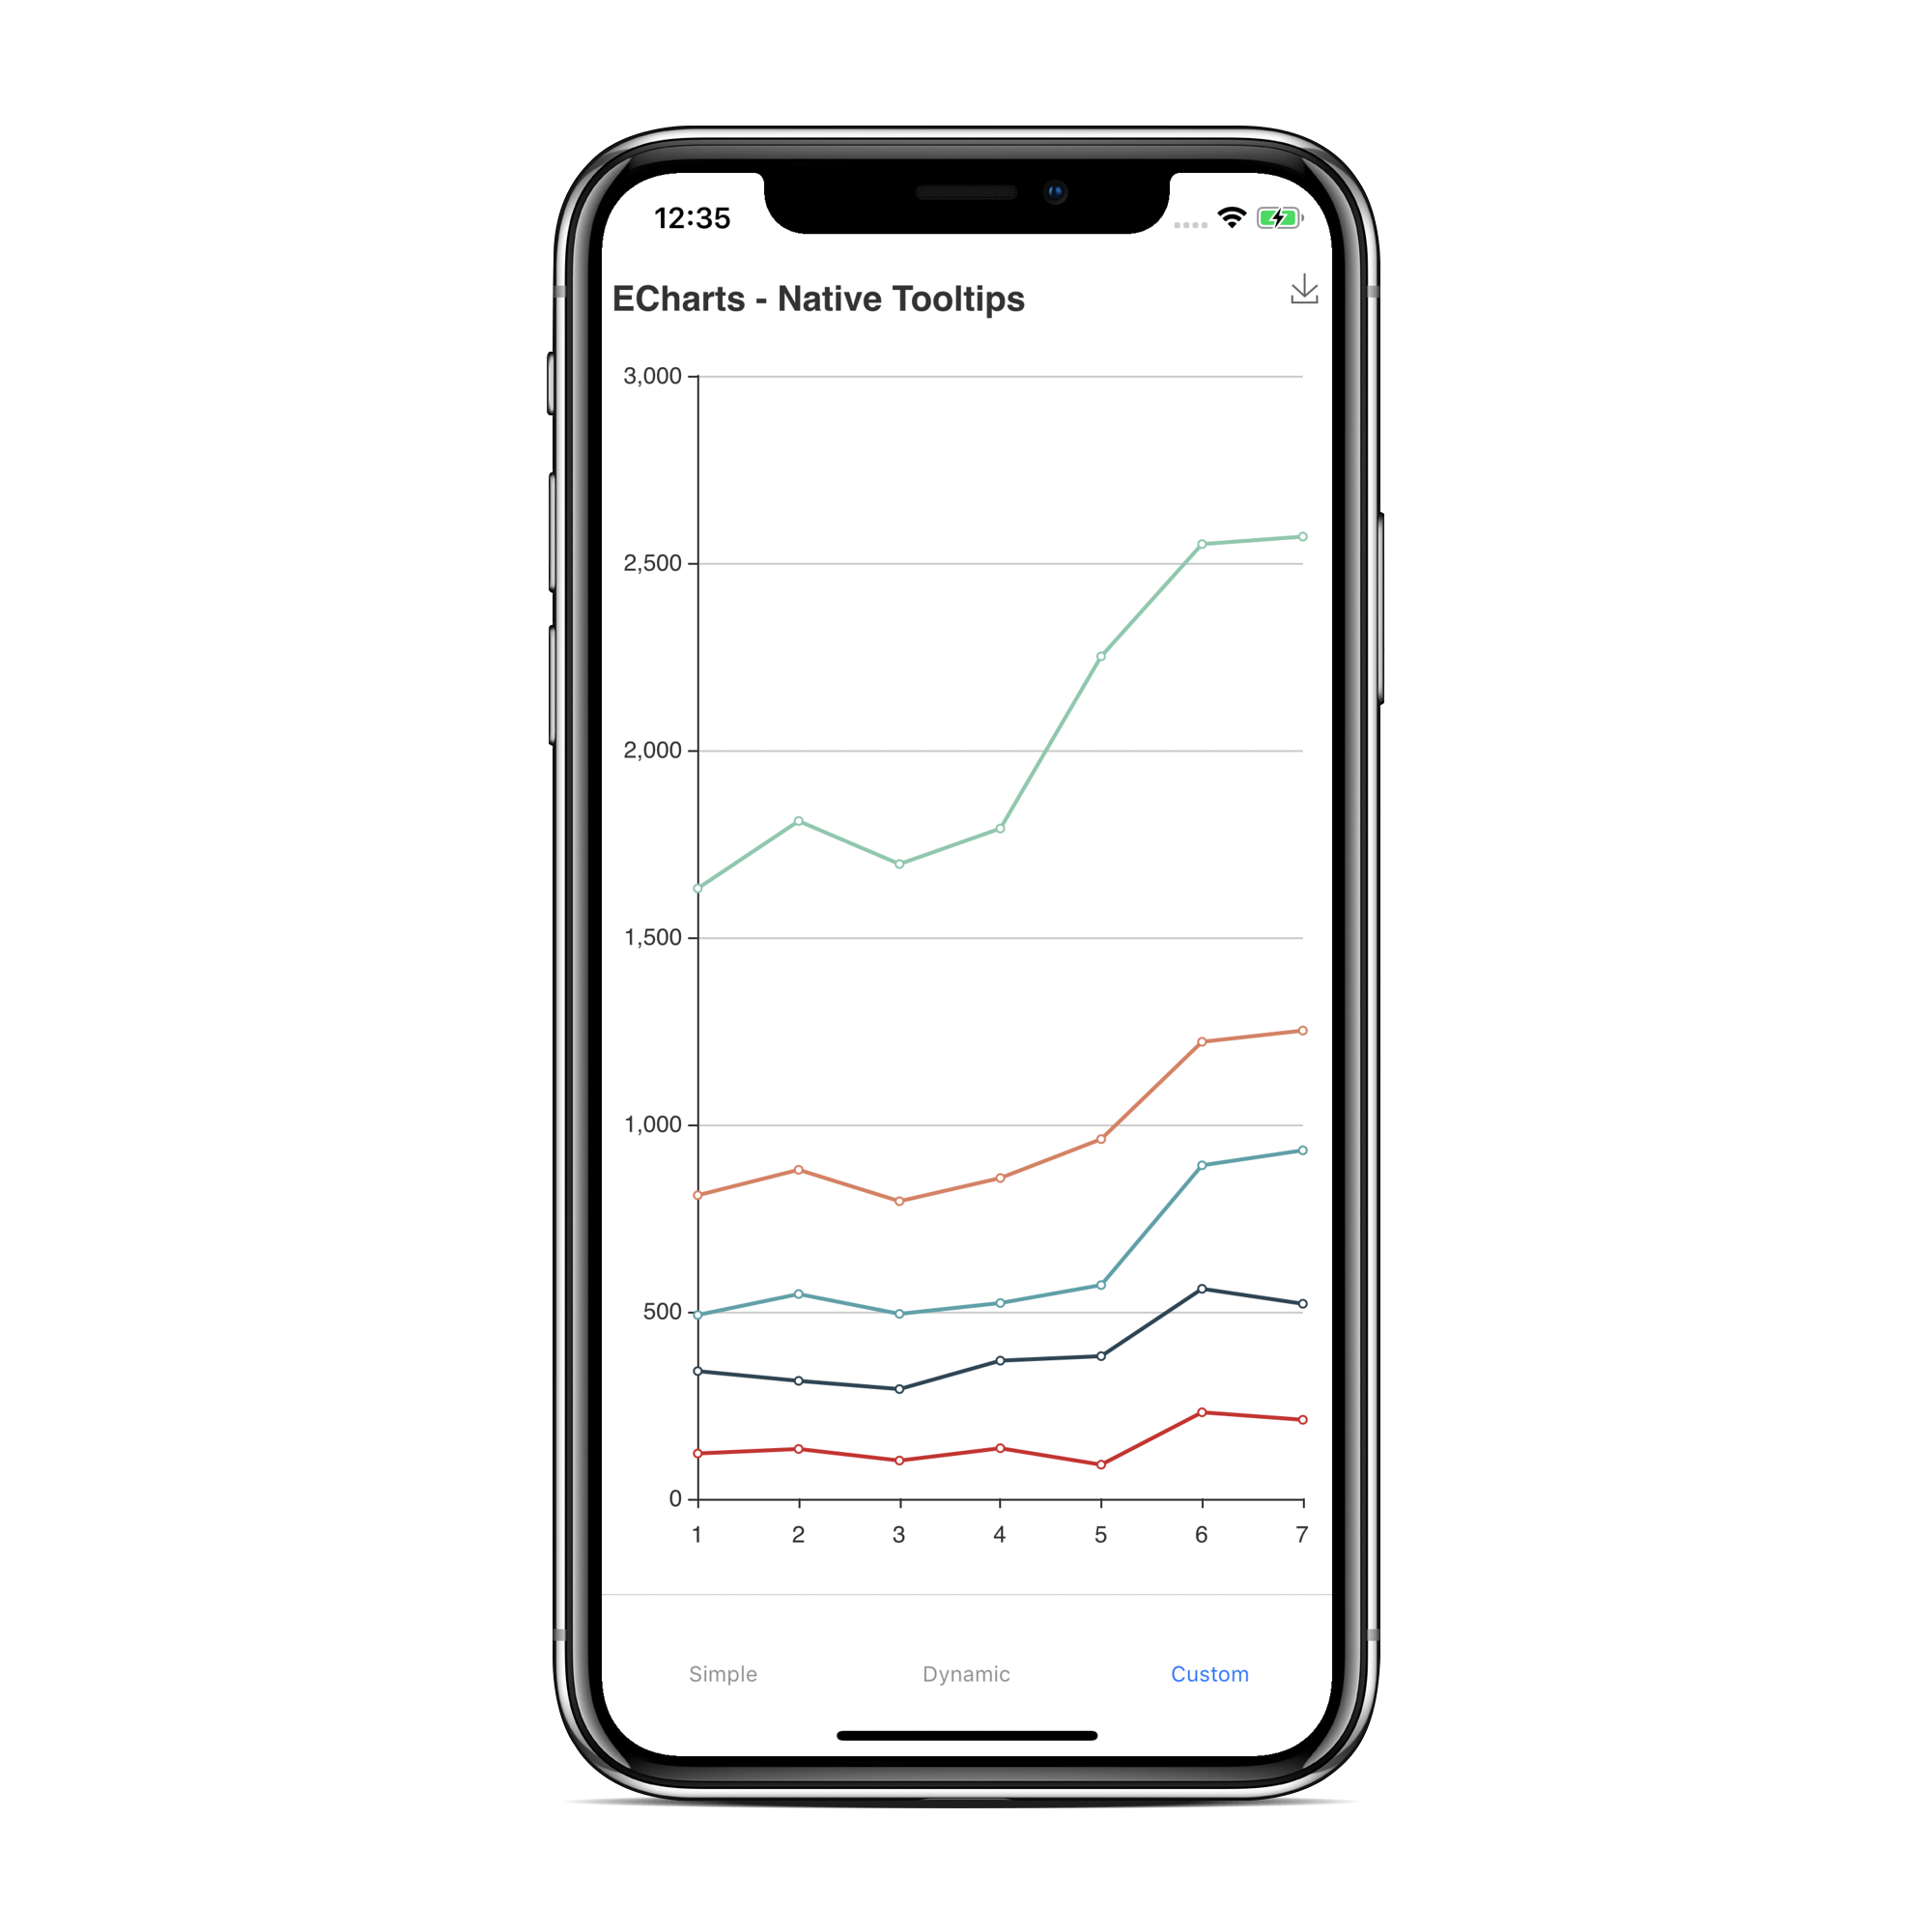
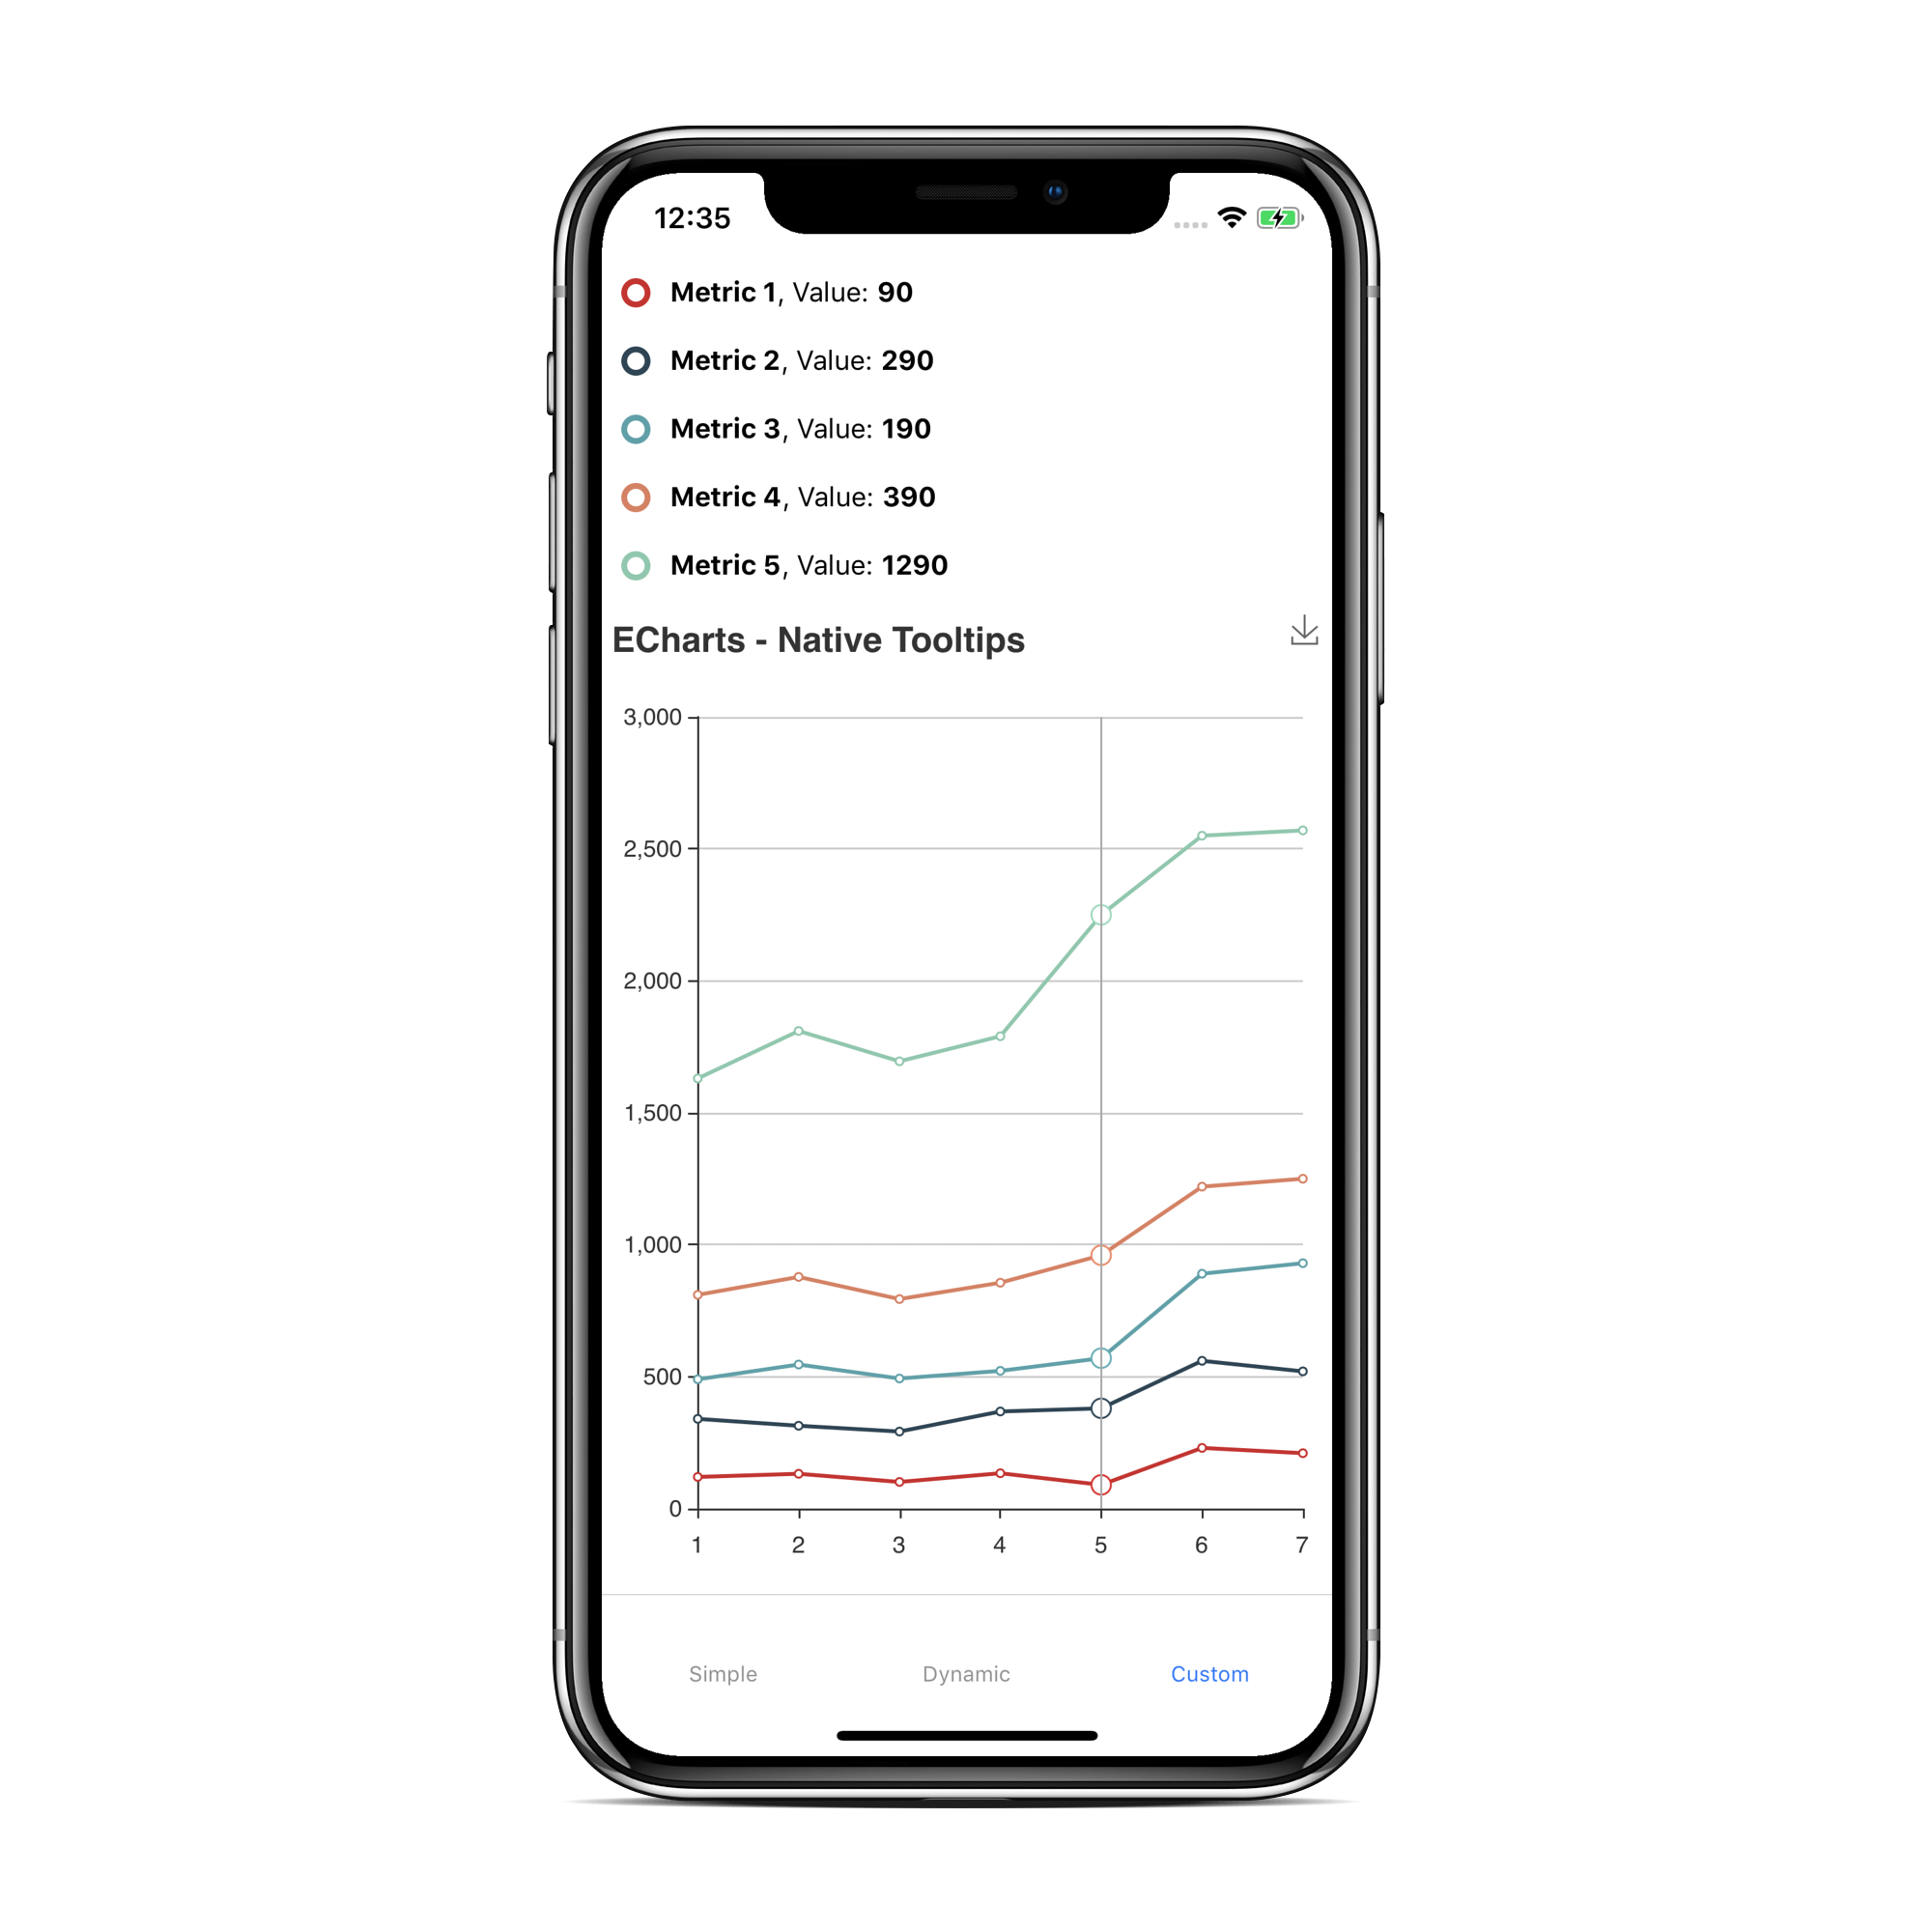
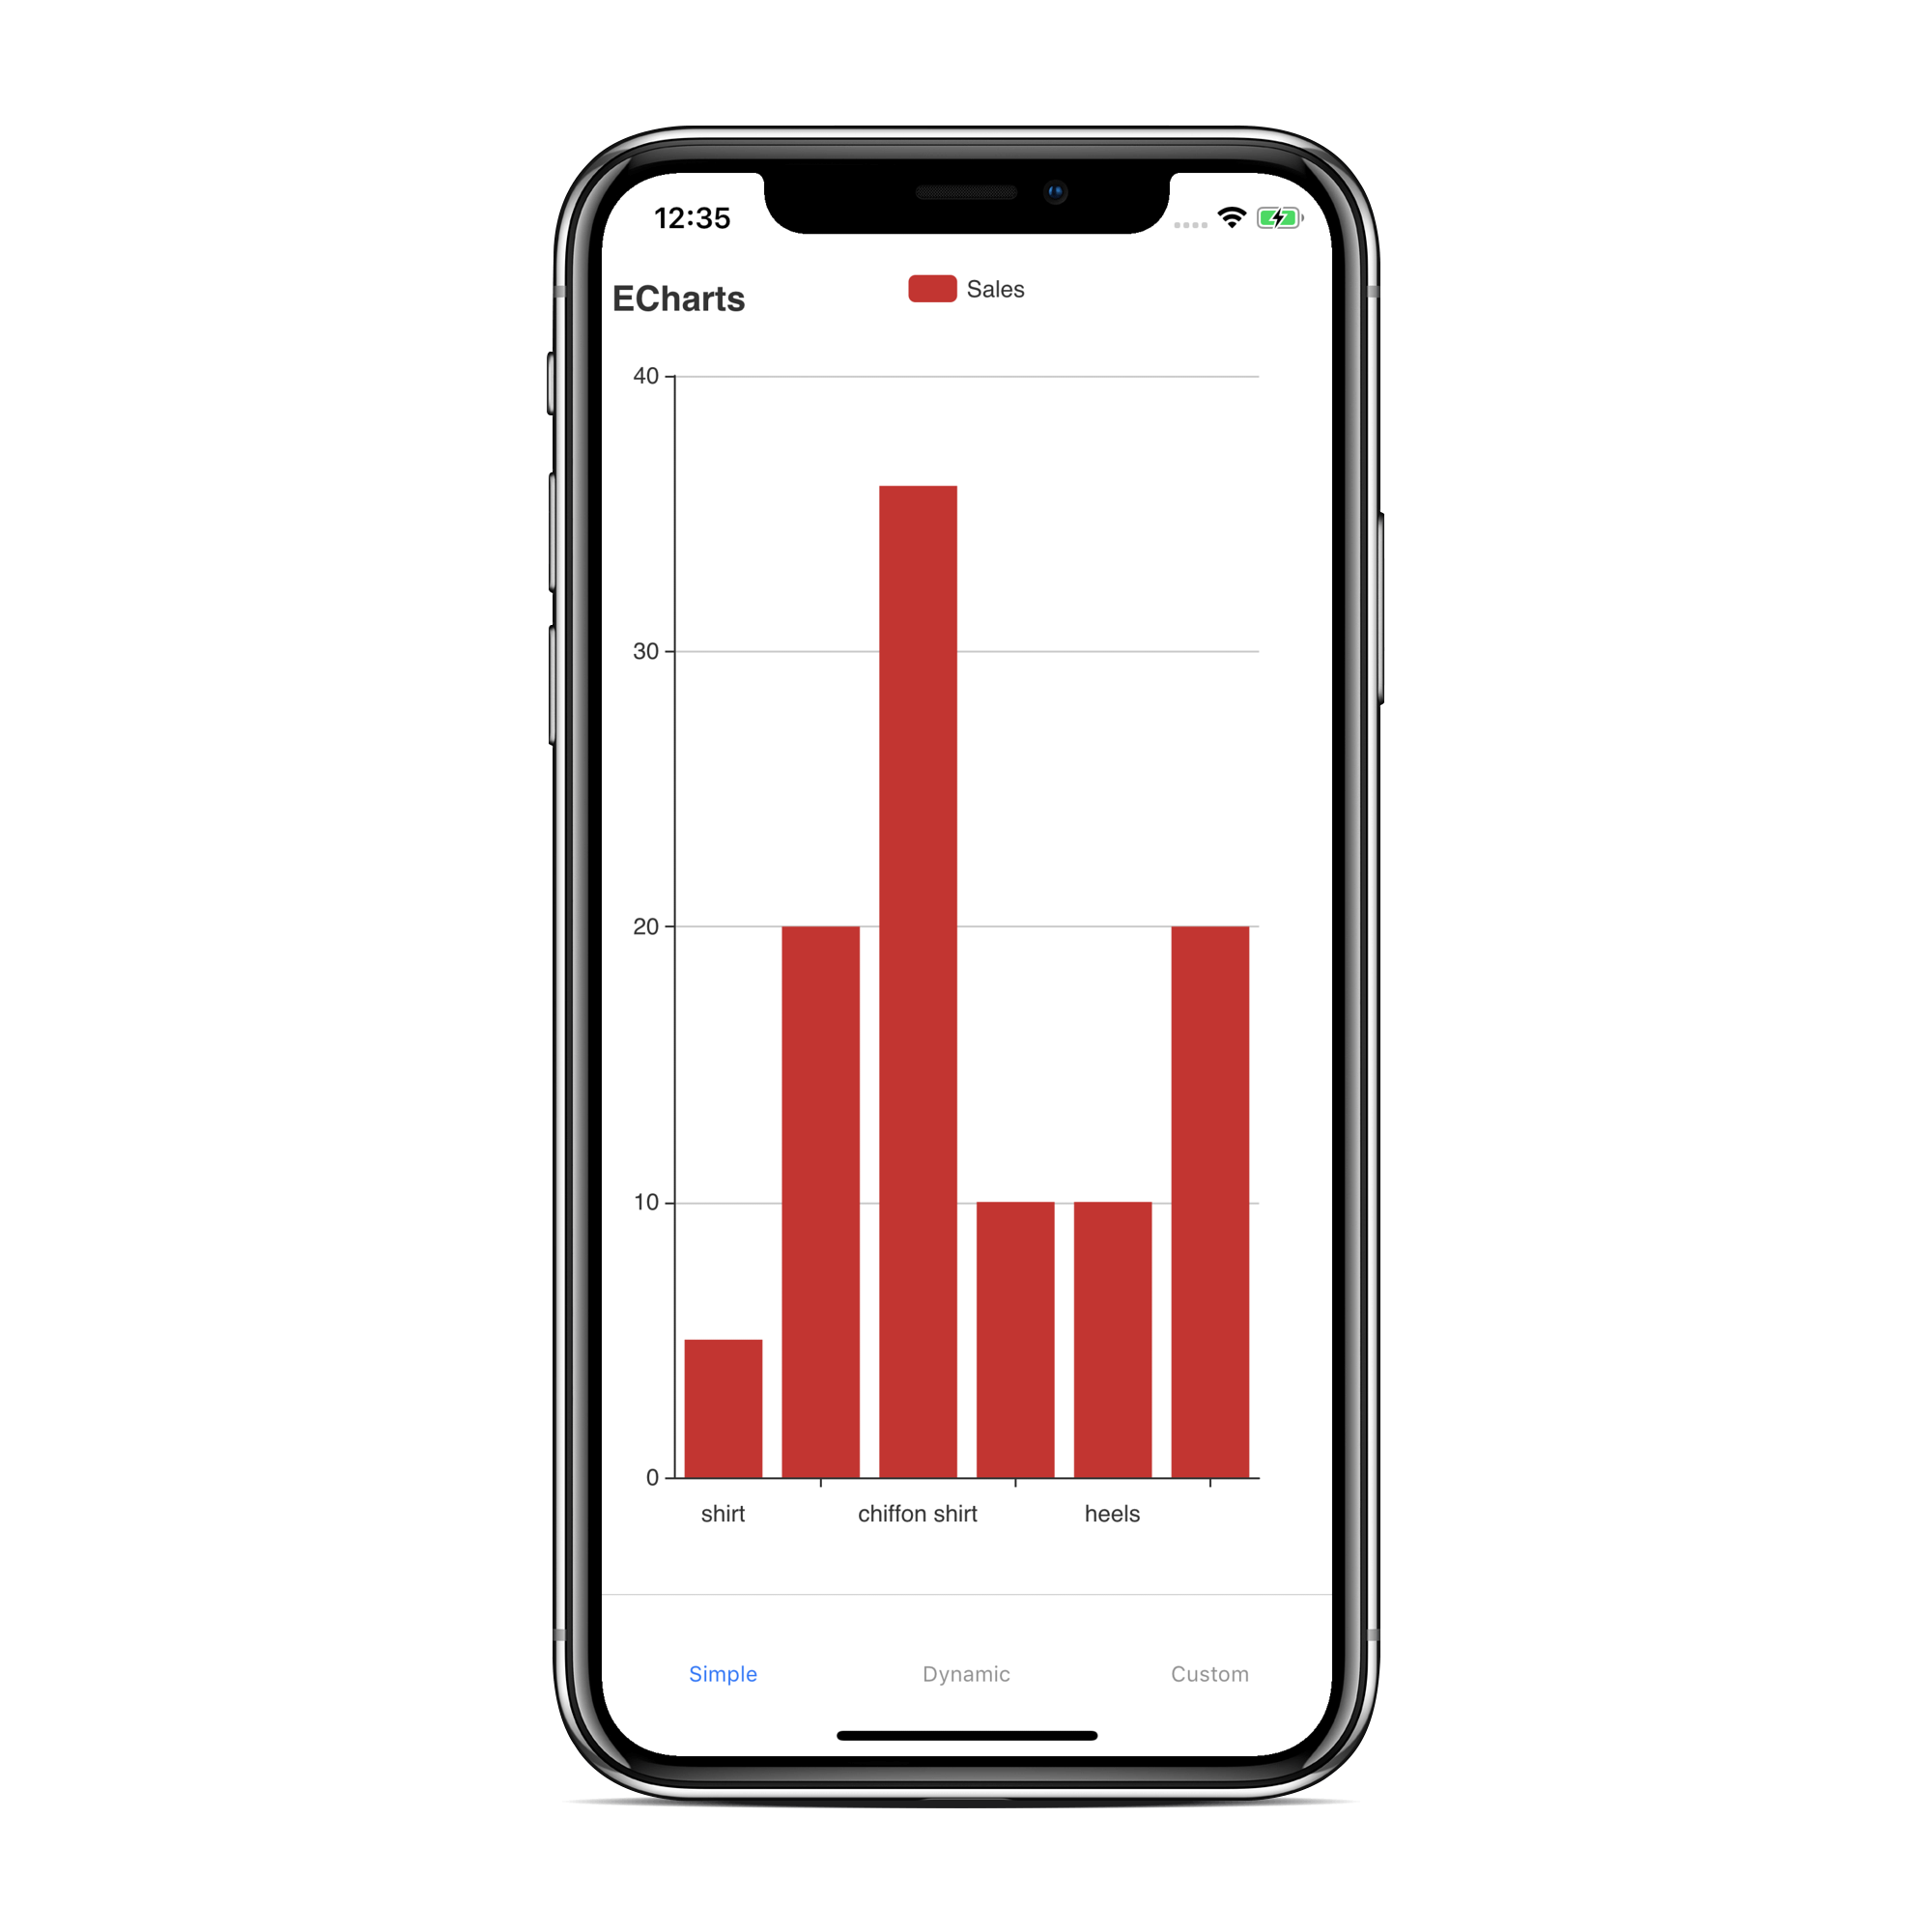
Screenshots
How To Use
$ yarn add react-native-echarts-wrapper
Make sure you installed react-native-webview
Supported Versions
| 2.x.x | >= 0.33 | >= 0.58 |
| 1.x.x | / | >= 0.56 |
Properties
| option | object | take a look at the examples | Allows you to set the chart configuration (https://ecomfe.github.io/echarts-examples/public/index.html). Never access anything related to your React-Native Javascript code within the options object. It won't work! Take a look at onData and sendData |
| customTemplatePath | string | file:///android_assets/index.html | Use this property if you want to tell echarts where to look for a custom html template. You can use RNFS to get the directory path for Android/iOS. |
| additionalCode | string | alert('hello world'); | Allows you to inject javascript code in the webview. It is used to access the echarts api to create more complex charts (e.G. callback on chart tap). Take a look at More complex example |
| backgroundColor | string | rgba(255,101,80,0.4), red, #4287f5 | Set the background color of the chart |
Methods / Callbacks
| setOption | this.chart.setOption(option); | Allows you to set a chart configuration dyanmically (e.g. after initial setup with option prop). Take a look at Dynamic loading example |
| getOption | this.chart.getOption((data) => console.log(data)); | Allows you to get the current option of a chart instance. First parameter is the result-callback. If you don't pass a second parameter the result-callback will be triggered with all option properties. Second parameter is an array of the e-charts-option-properties (e.g. ['dataZoom', 'series']) you want to get. Take a look at Dynamic loading example |
| clear | this.chart.clear(); | Allows you to clear the chart. Take a look at More complex example |
| onData | <ECharts onData={this.onData} /> | This is the only way to receive data from the chart. It is called with the data provided by sendData (Webview functions). |
| setBackgroundColor | this.chart.setBackgroundColor('#ecf542'); | Allows you to set the background color of the chart. |
Webview functions
These functions can be called from code injected with additionalCode or within the echarts option.
| sendData | sendData('Hello World') | With this function you can communicate with React Native. Attention you can only send strings over to React-Native. sendData('Hello World') will call onData on the React Native side. Take a look at More complex example |
Webview variables
Simple example
import React, { Component } from "react";
import { StyleSheet, View } from "react-native";
import { ECharts } from "react-native-echarts-wrapper";

export default class App extends Component {
  option = {
    xAxis: {
      type: "category",
      data: ["Mon", "Tue", "Wed", "Thu", "Fri", "Sat", "Sun"]
    },
    yAxis: {
      type: "value"
    },
    series: [
      {
        data: [820, 932, 901, 934, 1290, 1330, 1320],
        type: "line"
      }
    ]
  };

  render() {
    return (
      <View style={styles.chartContainer}>
        <ECharts
          option={this.option}
          backgroundColor="rgba(93, 169, 81, 0.3)"
        />
      </View>
    );
  }
}

const styles = StyleSheet.create({
  chartContainer: {
    flex: 1
  }
});
More complex example
import React, { Component } from "react";
import { StyleSheet, SafeAreaView, Button } from "react-native";
import { ECharts } from "react-native-echarts-wrapper";

export default class App extends Component {
  option = {
    xAxis: {
      type: "category",
      data: ["Mon", "Tue", "Wed", "Thu", "Fri", "Sat", "Sun"]
    },
    yAxis: {
      type: "value"
    },
    series: [
      {
        data: [820, 932, 901, 934, 1290, 1330, 1320],
        type: "line"
      }
    ]
  };

  additionalCode = `
        chart.on('click', function(param) {
            var obj = {
            type: 'event_clicked',
            data: param.data
            };

            sendData(JSON.stringify(obj));
        });
    `;

  onData = param => {
    const obj = JSON.parse(param);

    if (obj.type === "event_clicked") {
      alert(`you tapped the chart series: ${obj.data}`);
    }
  };

  onRef = ref => {
    if (ref) {
      this.chart = ref;
    }
  };

  onButtonClearPressed = () => {
    this.chart.clear();
  };

  render() {
    return (
      <SafeAreaView style={styles.chartContainer}>
        <Button title="Clear" onPress={this.onButtonClearPressed} />

        <ECharts
          ref={this.onRef}
          option={this.option}
          additionalCode={this.additionalCode}
          onData={this.onData}
          onLoadEnd={() => {
            this.chart.setBackgroundColor("rgba(93, 169, 81, 0.1)");
          }}
        />
      </SafeAreaView>
    );
  }
}

const styles = StyleSheet.create({
  chartContainer: {
    flex: 1,
    backgroundColor: "#F5FCFF"
  }
});
Dynamic loading example
import React, { Component } from "react";
import { StyleSheet, SafeAreaView, Button } from "react-native";
import { ECharts } from "react-native-echarts-wrapper";
export default class App extends Component {
onRef = ref => {
if (ref) {
this.chart = ref;
}
};
onData = param => {};
initChart = () => {
function randomData() {
now = new Date(+now + oneDay);
value = value + Math.random() * 21 - 10;
return {
name: now.toString(),
value: [
[now.getFullYear(), now.getMonth() + 1, now.getDate()].join("/"),
Math.round(value)
]
};
}
var data = [];
var now = +new Date(1997, 9, 3);
var oneDay = 24 * 3600 * 1000;
var value = Math.random() * 1000;
for (var i = 0; i < 1000; i++) {
data.push(randomData());
}
option = {
title: {
text: "Dynamic Chart"
},
tooltip: {
trigger: "axis",
formatter: function(params) {
params = params[0];
var date = new Date(params.name);
return (
date.getDate() +
"/" +
(date.getMonth() + 1) +
"/" +
date.getFullYear() +
" : " +
params.value[1]
);
},
axisPointer: {
animation: false
}
},
xAxis: {
type: "time",
splitLine: {
show: false
}
},
yAxis: {
type: "value",
boundaryGap: [0, "100%"],
splitLine: {
show: false
}
},
series: [
{
type: "line",
showSymbol: false,
hoverAnimation: false,
data: data
}
]
};
this.chart.setOption(option);
this.chart.getOption(option => {
console.log(option);
});
this.chart.getOption(
option => {
console.log(option);
},
["dataZoom", "series"]
);
const instance = this.chart;
setInterval(function() {
for (var i = 0; i < 5; i++) {
data.shift();
data.push(randomData());
}
instance.setOption({
series: [
{
data: data
}
]
});
}, 100);
};
render() {
return (
<SafeAreaView style={styles.chartContainer}>
<Button title="Start" onPress={this.initChart} />
<ECharts
option={{}}
ref={this.onRef}
additionalCode={this.additionalCode}
onData={this.onData}
/>
</SafeAreaView>
);
}
}
const styles = StyleSheet.create({
chartContainer: {
flex: 1,
backgroundColor: "#F5FCFF"
}
});
[2.0.0] - Thursday, 03.October 2019
Breaking Changes
- removed property canvas (canvas renderer default)
- removed legacyMode (react-native-webview required)
- removed baseUrl
Added
- customTemplatePath prop allows to set the path to a custom html-file (template: node_modules/react-native-echarts-wrapper/dist/index.html)
Fixed
- Tried to register two views with the same name RNCWebView? (#35)
- Got rejected from Apple review (#31)
- usage on expo as there is no android_asset folder (#19)
- cannot use '\n' in custom format text (#14)
[1.4.7] - Thursday, 12.September 2019
Fixed
[1.4.5] - Saturday, 17.August 2019
Added
- Loading state/Background Color (#17)
[1.4.4] - Thursday, 08.August 2019
Fixed
[1.4.3] - Tuesday, 06.August 2019
Fixed
- Broken on React Native >= 0.60.0 (Invariant Violation: Element type is invalid) (#27)
[1.4.2] - Wednesday, 31.July 2019
Fixed
- fix arrow function not working on old version Android webview (#25)
[1.4.1] - Tuesday, 25.June 2019
Fixed
- Dynamic loading issue on iOS (#16)
[1.4.0] - Monday, 20.May 2019
Fixed
- Doesn't work on iOS in Expo (#13)
Added
[1.3.0] - Thursday, 18.Apr 2019
Added
- tests, coverage, build report
Fixed
- Blank page on Android (#10)
[1.2.2] - Monday, 18.Feb 2019
Fixed
- crash when not passing an option
[1.2.1] - Wednesday, 16.Jan 2019
Added
[1.1.1] - Tuesday, 27.Nov 2018
Fixed
- Documentation missing (#3)
[1.1.0] - Saturday, 17.Nov 2018
Added
- baseUrl prop allows to access local content within the Webview on iOS and Android
- additionalCode prop allows to create more complex chart configurations (e.G.
chart.on('click')
[1.0.4] - Monday, 5.Nov 2018
Fixed
- Functions in options do not work when setting via 'setOptions'
Authors
Contributors
See also the list of contributors who participated in this project.


