字节小程序 VChart 图表组件
TODO:待整理
@visactor/tt-vchart 是 VChart 为字节小程序封装的图表组件库,用于支持字节小程序上的图表渲染。支持通过 npm 方式引入, 此外也直接拷贝组件到自己的项目下使用。
通过 npm 使用
字节跳动开发者工具, npm 能力从基础库版本 2.12.0 开始支持,IDE 版本 3.1.1 开始支持。
相关文档请参考: npm 能力
Step1: 安装图表组件
在小程序 package.json 所在的目录中执行命令安装 npm 包:
npm install @dp/tt-chartspace
- 参与构建 npm 的 package.json 需要在 project.config.json 定义的 miniprogramRoot 之内。 miniprogramRoot 字段不存在时,miniprogramRoot 指向的就是 project.config.json 所在的目录。
- 打包构建 npm 依赖时根据 package.json 的 dependencies 字段。 devDependencies 里的依赖也可以在开发过程中被安装使用而不会参与到构建中。
Step2: 构建 npm
- 编辑器"侧边栏" 打开 NPM 模块的面板
- 点击 “构建 NPM” 按钮
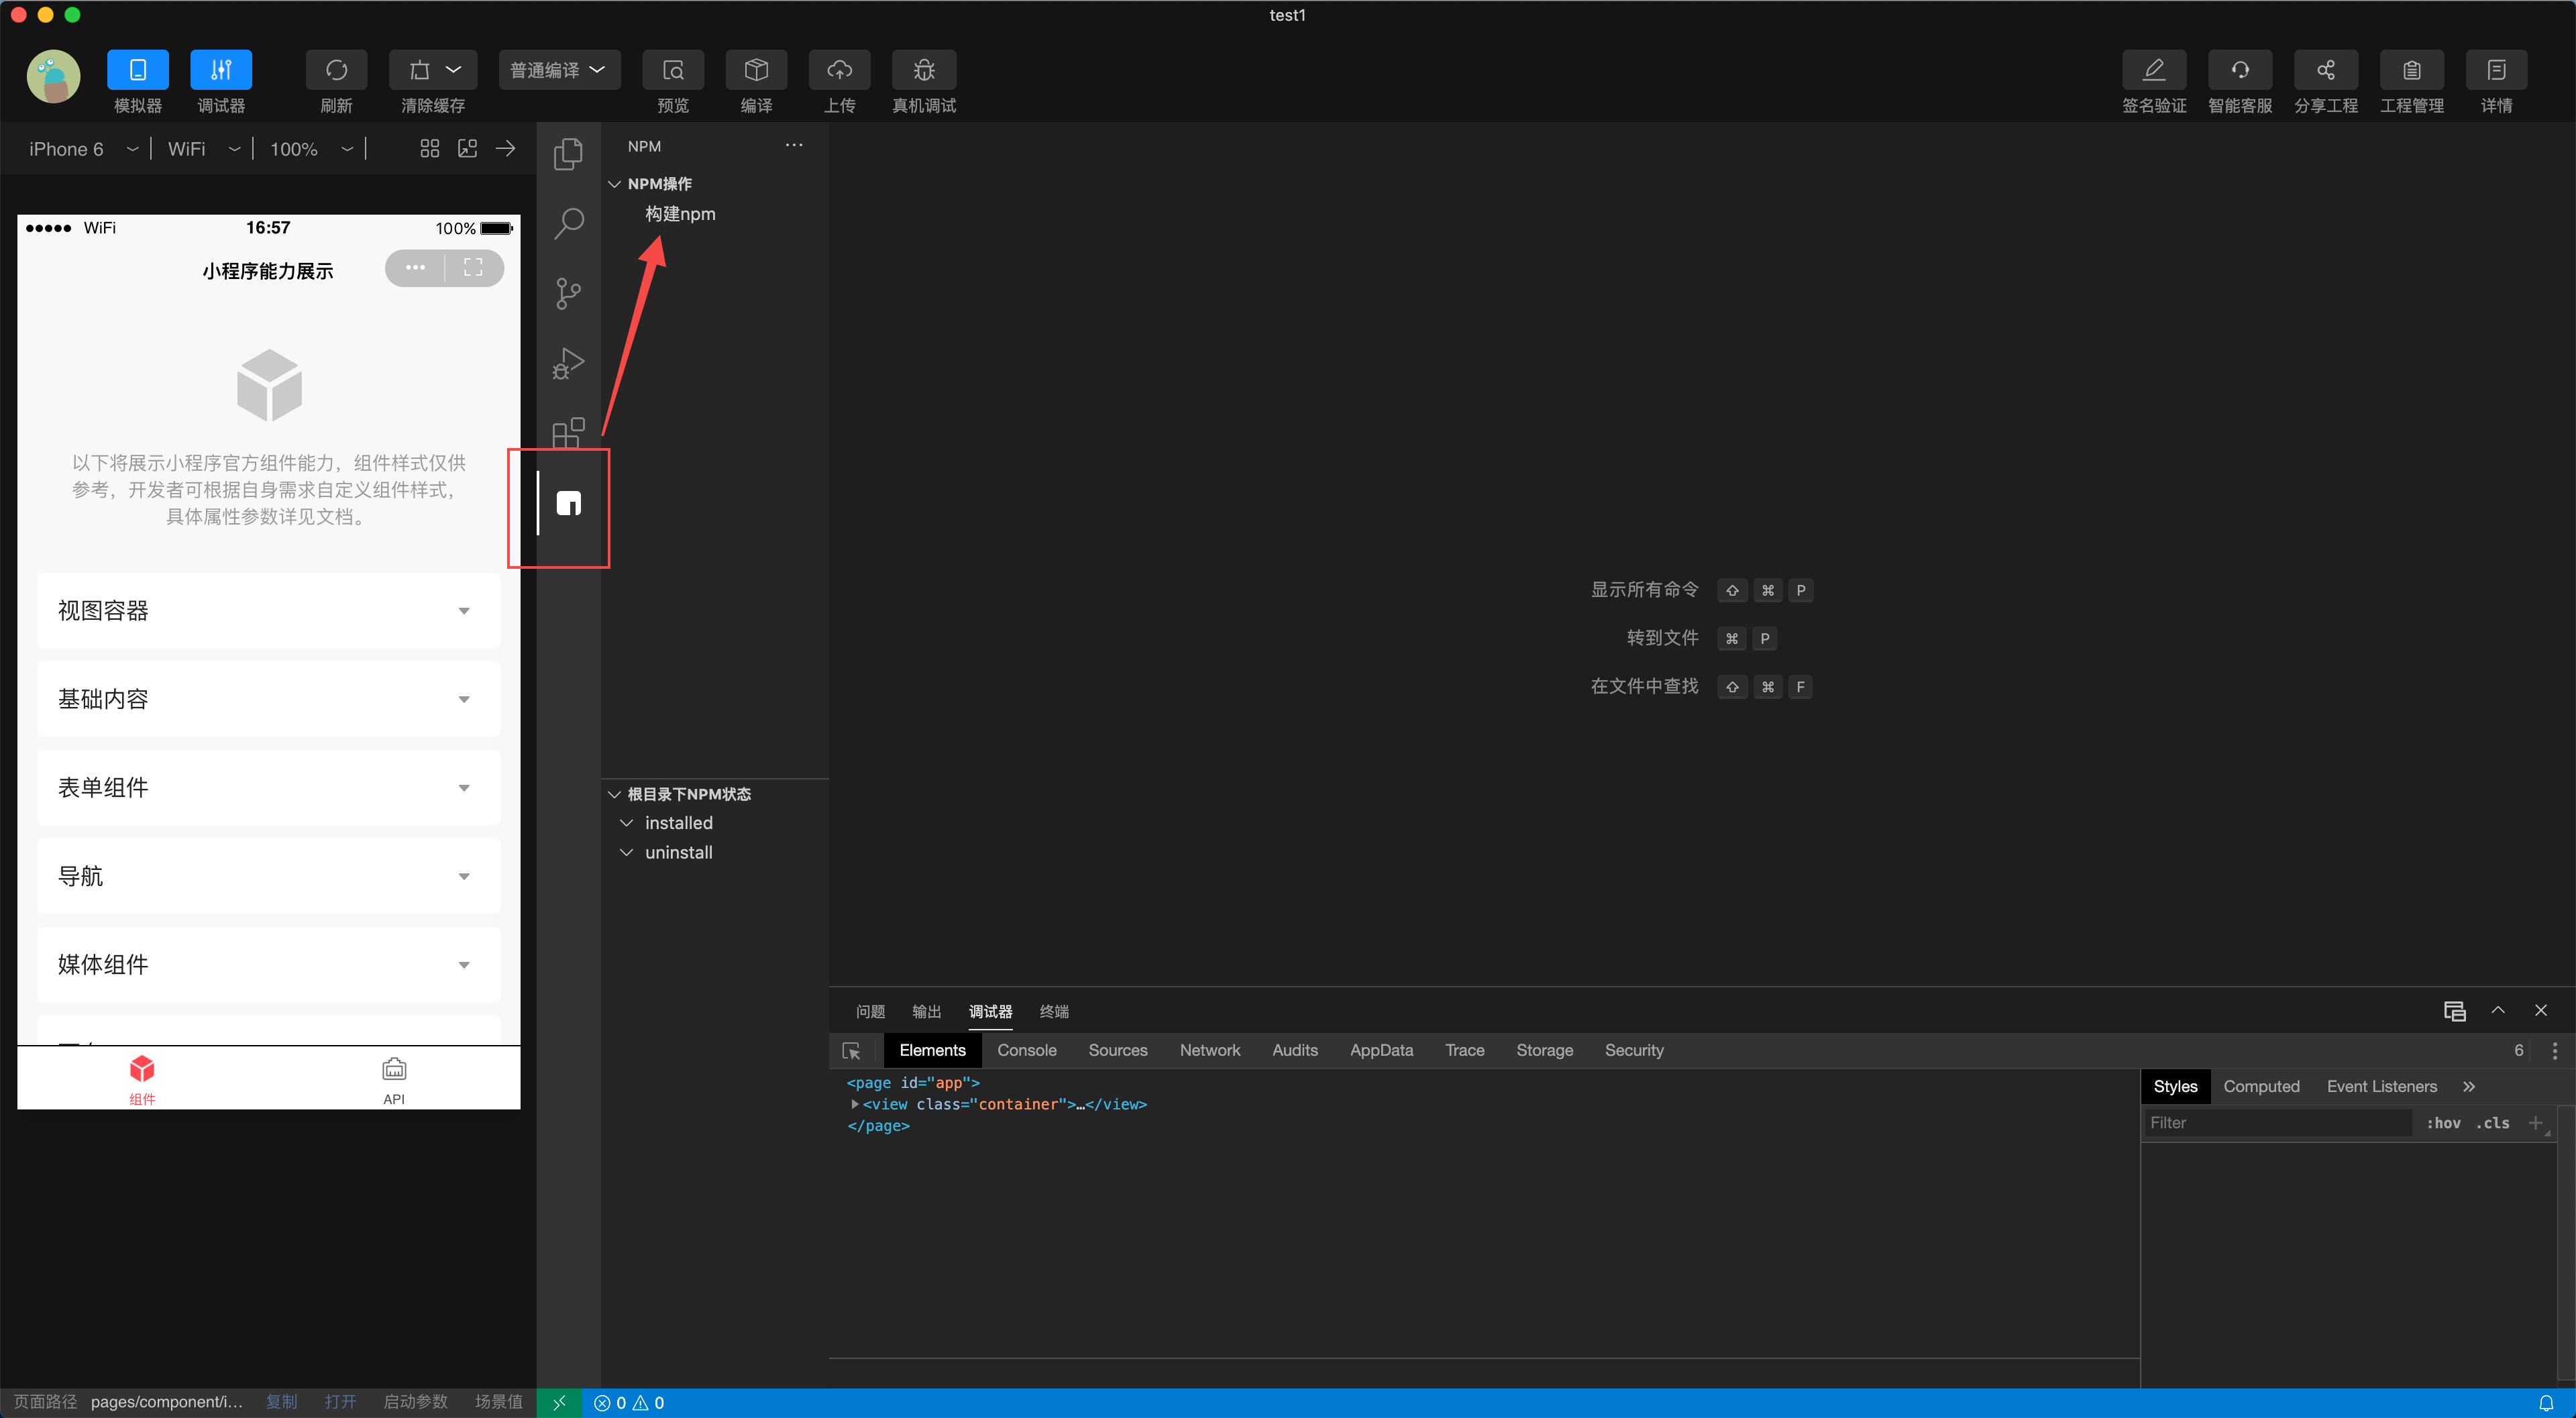
构建完成后, 项目会出现 miniprogram_npm的构建文件.
Step3: 创建 Demo 页面
结构如下:
├── pages
│   └── demo
│       └── index.js     # 页面js
│       ├── index.json   # 页面json配置
│       ├── index.ttml   # 页面xml结构
│       ├── index.ttss   # 页面样式
Step4: 引用组件
在 index.json 中配置如下内容即可:
{
  "usingComponents": {
    "chart": "ext://@dp/tt-chartspace/index"
  }
}
ext://@dp/tt-chartspace/index是小程序端的特殊规则: 通过 npm 引用自定义组件, 路径引用的格式需要遵守: ext://packageName/componentName
其中
ext:// 为小程序规范的前缀.packageName 为 npm 包名componentName 为组件名称.
与我们的图表组件对应起来:
packageName 为: @dp/tt-chartspacecomponentName 为: index(由 chartspace 组件库预设)
更加细致的描述, 请参考: 使用 npm
Step5: 创建图表
- 在 index.ttml 准备如下的 xml 结构:
<view tt:if="{{ spec }}">
    <chart
    canvasId="{{ canvasId }}"
    spec="{{ spec }}"
    styles="{{ styles }}"
    events="{{ events }}"
    onChartInit="{{ onChartInit }}"
    onChartReady="{{ onChartReady }}" />
</view>
参考示例:
Page({
data: {
canvasId: 'chartId',
events: [],
styles: `
height: 50vh;
width: 100%
`,
spec: {
data: [
{
name: 'data1',
values: [
{
value: 335,
name: '直接访问'
},
{
value: 310,
name: '邮件营销'
},
{
value: 274,
name: '联盟广告'
},
{
value: 123,
name: '搜索引擎'
},
{
value: 215,
name: '视频广告'
}
]
}
],
type: 'pie',
radius: 0.6,
nameField: 'name',
valueField: 'value',
legends: {
discreteLegend: {
visible: true,
orient: 'bottom'
}
},
labels: {
visible: true
},
labelLine: {
smooth: true,
strokeColor: '#468DFF',
strokeWidth: 1
},
tooltip: {
target: {
content: [
{
hasShape: true,
key: 'name',
value: 'value'
}
]
}
}
}
},
onLoad: function (options) {}
});
拷贝组件使用
通过 npm 安装后, 可以直接将@dp/tt-chartspace/src目录下的所有文件拷贝到自己的项目中. 自行设置usingComponents即可.
自定义组件配置说明
图表目前对外暴露的接口有以下 6 个. 其中, spec 的使用方式与 PC 端无差异.
| canvasId | String | 图表唯一 Id |
| spec | Object | 图表配置项, 参考 配置文档 |
| styles | String | 图表容器样式 |
| events | Object[] | 自定义事件 |
| onChartInit | Function | 图表初始化时的回调 |
| onChartReady | Function | 图表渲染完毕的回调 |
更多功能请查看chartspace 官方网站
问题反馈
如果在使用过程中发现问题,欢迎在 onCall 群中向我们反馈,谢谢!