Product
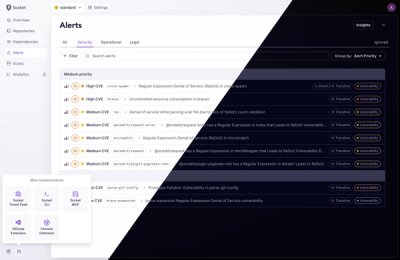
A Fresh Look for the Socket Dashboard
We’ve redesigned the Socket dashboard with simpler navigation, less visual clutter, and a cleaner UI that highlights what really matters.
By André Staltz, Jeppe Hasseriis, Nolan Lawson - Jun 23, 2025
@visx/scale
Advanced tools
@visx/scale is a part of the VisX library, which provides a collection of reusable low-level visualization components for React. The @visx/scale package specifically deals with creating and managing scales, which are functions that map data values to visual values. These scales are essential for creating visualizations like charts and graphs.
Linear Scale
Creates a linear scale that maps a domain of [0, 100] to a range of [0, 500]. This is useful for creating continuous scales for visualizations like line charts.
const scaleLinear = require('@visx/scale').scaleLinear;
const linear = scaleLinear({
domain: [0, 100],
range: [0, 500]
});
console.log(linear(50)); // 250Band Scale
Creates a band scale that maps categorical data to a range. This is useful for creating bar charts where each category needs to be spaced evenly.
const scaleBand = require('@visx/scale').scaleBand;
const band = scaleBand({
  domain: ['A', 'B', 'C'],
  range: [0, 300],
  padding: 0.1
});
console.log(band('B')); // 110
Time Scale
Creates a time scale that maps dates to a range. This is useful for visualizing time series data.
const scaleTime = require('@visx/scale').scaleTime;
const time = scaleTime({
  domain: [new Date(2020, 0, 1), new Date(2020, 11, 31)],
  range: [0, 365]
});
console.log(time(new Date(2020, 5, 15))); // 165
Logarithmic Scale
Creates a logarithmic scale that maps a domain to a range. This is useful for visualizing data that spans several orders of magnitude.
const scaleLog = require('@visx/scale').scaleLog;
const log = scaleLog({
  domain: [1, 100],
  range: [0, 2]
});
console.log(log(10)); // 1d3-scale is a part of the D3.js library and provides similar functionality for creating scales. It supports a wide variety of scale types including linear, logarithmic, time, and ordinal scales. Compared to @visx/scale, d3-scale is more widely used and has a larger community, but @visx/scale is more tailored for use with React.
Victory is a React library for creating data visualizations. It includes built-in support for scales and provides a higher-level API compared to @visx/scale. While @visx/scale offers more flexibility and lower-level control, Victory is easier to use for common chart types.
Recharts is another React library for building charts. It provides a set of declarative components for creating charts and includes built-in support for scales. Recharts is more opinionated and easier to use for standard chart types, whereas @visx/scale offers more customization and flexibility.

npm install --save @visx/scale
The @visx/scale package aims to provide a wrapper around existing d3 scaling originally defined
in the d3-scale package.
Scales are functions that help you map your data values to the physical pixel size that your graph requires. For example, let's say you wanted to create a bar chart to show populations per country. If you were to use a 1-to-1 scale (IE: 1 pixel per y value) your bar for the USA would be about 321.4 million pixels high!
Instead, you can tell visx a function to use that takes a data value (like your population per
country) and quantitatively maps to another dimensional space, like pixels.
For example, we could create a linear scale like this:
const graphWidth = 500;
const graphHeight = 200;
const [minX, maxX] = getXMinAndMax();
const [minY, maxY] = getYMinAndMax();

const xScale = Scale.scaleLinear({
  domain: [minX, maxX], // x-coordinate data values
  range: [0, graphWidth], // svg x-coordinates, svg x-coordinates increase left to right
  round: true,
});

const yScale = Scale.scaleLinear({
  domain: [minY, maxY], // y-coordinate data values
  // svg y-coordinates, these increase from top to bottom so we reverse the order
  // so that minY in data space maps to graphHeight in svg y-coordinate space
  range: [graphHeight, 0],
  round: true,
});

// ...

const points = data.map((d, i) => {
  const barHeight = graphHeight - yScale(d.y);
  return <Shape.Bar height={barHeight} y={graphHeight - barHeight} />;
});
Example:
const scale = Scale.scaleBand({
  /*
    range,
    round,
    domain,
    padding,
    nice = false
  */
});
Example:
const scale = Scale.scaleLinear({
  /*
    range,
    round,
    domain,
    nice = false,
    clamp = false,
  */
});
Example:
const scale = Scale.scaleLog({
  /*
    range,
    round,
    domain,
    base,
    nice = false,
    clamp = false,
  */
});
Important note: As log(0) = -∞, a log scale domain must be strictly-positive or strictly-negative; the domain must not include or cross zero.
Example:
const scale = Scale.scaleRadial({
  /*
    range,
    round,
    domain,
    nice = false,
    clamp = false,
  */
});
Example:
const scale = Scale.scaleOrdinal({
  /*
    range,
    domain,
    unknown,
  */
});
Example:
const scale = Scale.scalePoint({
  /*
    range,
    round,
    domain,
    padding,
    align,
    nice = false,
  */
});
Example:
const scale = Scale.scalePower({
  /*
    range,
    round,
    domain,
    exponent,
    nice = false,
    clamp = false,
  */
});
Example:
// No need to set the exponent, It is always 0.5
const scale = Scale.scaleSqrt({
  /*
    range,
    round,
    domain,
    nice = false,
    clamp = false,
  */
});
Example:
const scale = Scale.scaleTime({
  /*
    range,
    round,
    domain,
    nice = false,
    clamp = false,
   */
});
You also can scale time with Coordinated Universal Time via scaleUtc.
Example:
const scale = Scale.scaleUtc({
  /*
    range,
    round,
    domain,
    nice = false,
    clamp = false,
   */
});
D3 scales offer the ability to map points to colors. You can use
d3-scale-chromatic in conjunction with visx's
scaleOrdinal to make color scales.
You can install d3-scale-chromatic with npm:
npm install --save d3-scale-chromatic
You create a color scale like so:
import { scaleOrdinal } from '@visx/scale';
import { schemeSet1 } from 'd3-scale-chromatic';

const colorScale = scaleOrdinal({
  domain: arrayOfThings,
  range: schemeSet1,
});
This generates a color scale with the following colors:

There are a number of other categorical color schemes available, along with other continuous color schemes.
FAQs
visx scale
The npm package @visx/scale receives a total of 633,219 weekly downloads. As such, @visx/scale popularity was classified as popular.
We found that @visx/scale demonstrated a healthy version release cadence and project activity because the last version was released less than a year ago. It has 4 open source maintainers collaborating on the project.
Did you know?

Socket for GitHub automatically highlights issues in each pull request and monitors the health of all your open source dependencies. Discover the contents of your packages and block harmful activity before you install or update your dependencies.
Product
We’ve redesigned the Socket dashboard with simpler navigation, less visual clutter, and a cleaner UI that highlights what really matters.

Industry Insights
Terry O’Daniel, Head of Security at Amplitude, shares insights on building high-impact security teams, aligning with engineering, and why AI gives defenders a fighting chance.

Security News
MCP spec updated with structured tool output, stronger OAuth 2.1 security, resource indicators, and protocol cleanups for safer, more reliable AI workflows.