Product
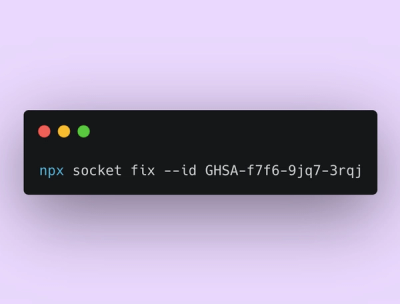
Announcing Socket Fix 2.0
Socket Fix 2.0 brings targeted CVE remediation, smarter upgrade planning, and broader ecosystem support to help developers get to zero alerts.
andrasq-v8-profiler
Advanced tools
This is a fork of @risingstack/v8-profiler@5.7.12, modified to work with node-v10 and to not need node-pre-gyp.
v8-profiler provides node bindings for the v8 profiler and integration with node-inspector
npm install v8-profiler
var profiler = require('v8-profiler');
takeSnapshot([name]) - returns new HEAP Snapshot instance. name is optional argument, by default snapshot name will be constructed from his uid.
deleteAllSnapshots() - works as described in name.
var snapshot1 = profiler.takeSnapshot('1');
var snapshot2 = profiler.takeSnapshot();
profiler.deleteAllSnapshots();
startProfiling([name], [recsamples]) - start CPU profiling. name is optional argument, by default profile name will be constructed from his uid. recsamples is true by default.
stopProfiling([name]) - returns new CPU Profile instance. There is no strictly described behavior for usage without name argument.
setSamplingInterval([num]) - Changes default CPU profiler sampling interval to the specified number of microseconds. Default interval is 1000us. This method must be called when there are no profiles being recorded. If called without arguments it resets interval to default.
deleteAllProfiles() - works as described in name.
profiler.startProfiling('', true);
setTimeout(function() {
  var profile = profiler.stopProfiling('');
  profiler.deleteAllProfiles();
}, 1000);
Snapshot.getHeader() - provides short information about snapshot.
Snapshot.compare(snapshot) - creates HEAP diff for two snapshots.
Snapshot.delete() - removes snapshot from memory.
Snapshot.export([callback]) - provides simple export API for snapshot. callback(error, data) receives serialized snapshot as second argument. (Serialization is not equal to JSON.stringify result).
If callback will not be passed, export returns transform stream.
Snapshot.serialize - low level serialization method. Look Snapshot.export source for usage example.
var fs = require('fs');
var profiler = require('v8-profiler');
var snapshot1 = profiler.takeSnapshot();
var snapshot2 = profiler.takeSnapshot();

console.log(snapshot1.getHeader(), snapshot2.getHeader());

console.log(snapshot1.compare(snapshot2));

// Export snapshot to file file
snapshot1.export(function(error, result) {
  fs.writeFileSync('snapshot1.json', result);
  snapshot1.delete();
});

// Export snapshot to file stream
snapshot2.export()
  .pipe(fs.createWriteStream('snapshot2.json'))
  .on('finish', snapshot2.delete);
Profile.getHeader() - provides short information about profile.
Profile.delete() - removes profile from memory.
Profile.export([callback]) - provides simple export API for profile. callback(error, data) receives serialized profile as second argument. (Serialization is equal to JSON.stringify result).
var fs = require('fs');
var profiler = require('v8-profiler');
profiler.startProfiling('1', true);
var profile1 = profiler.stopProfiling();
profiler.startProfiling('2', true);
var profile2 = profiler.stopProfiling();

console.log(snapshot1.getHeader(), snapshot2.getHeader());

profile1.export(function(error, result) {
  fs.writeFileSync('profile1.json', result);
  profile1.delete();
});

profile2.export()
  .pipe(fs.createWriteStream('profile2.json'))
  .on('finish', function() {
    profile2.delete();
  });
Cpu profiles can be viewed and heap snapshots may be taken and viewed from the profiles panel.
FAQs
node bindings for the v8 profiler
We found that andrasq-v8-profiler demonstrated a not healthy version release cadence and project activity because the last version was released a year ago. It has 1 open source maintainer collaborating on the project.
Did you know?

Socket for GitHub automatically highlights issues in each pull request and monitors the health of all your open source dependencies. Discover the contents of your packages and block harmful activity before you install or update your dependencies.

Product
Socket Fix 2.0 brings targeted CVE remediation, smarter upgrade planning, and broader ecosystem support to help developers get to zero alerts.

Security News
Socket CEO Feross Aboukhadijeh joins Risky Business Weekly to unpack recent npm phishing attacks, their limited impact, and the risks if attackers get smarter.

Product
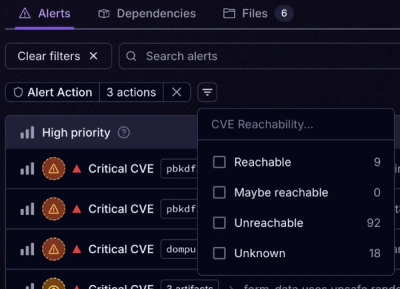
Socket’s new Tier 1 Reachability filters out up to 80% of irrelevant CVEs, so security teams can focus on the vulnerabilities that matter.