Product
Announcing Socket Fix 2.0
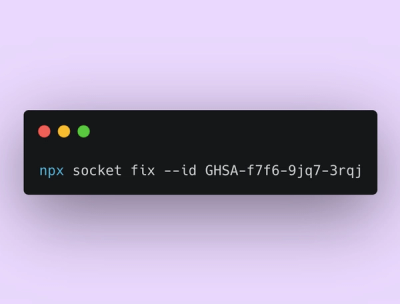
Socket Fix 2.0 brings targeted CVE remediation, smarter upgrade planning, and broader ecosystem support to help developers get to zero alerts.
A comprehensive, feature-rich stock chart library built on top of ApexCharts. ApexStock provides professional-grade financial charting capabilities with technical indicators, drawing tools, theme support, and an intuitive interface.
npm install apexcharts
npm install apexstock
// Basic HTML structure
<div id="chart-container"></div>;

// JavaScript
const chartEl = document.getElementById("chart-container");

const chartOptions = {
  chart: {
    height: 600,
  },
  series: [
    {
      name: "Stock Price",
      data: [
        {
          x: new Date("2024-01-01"),
          o: 100,
          h: 110,
          l: 95,
          c: 105,
          v: 1000000,
        },
        {
          x: new Date("2024-01-02"),
          o: 105,
          h: 115,
          l: 100,
          c: 112,
          v: 1200000,
        },
        // ... more OHLCV data
      ],
    },
  ],
  theme: {
    mode: "light", // or 'dark'
  },
};

const apexStock = new ApexStock(chartEl, chartOptions);
apexStock.render();
const chartOptions = {
  chart: {
    height: 600, // Chart height in pixels
    id: "my-chart", // Chart ID (auto-generated if not provided)
    type: "candlestick", // Chart type (set automatically)
  },

  series: [
    {
      name: "Stock Price",
      data: [
        // OHLCV data format
        {
          x: timestamp, // Date/timestamp
          o: openPrice, // Open price
          h: highPrice, // High price
          l: lowPrice, // Low price
          c: closePrice, // Close price
          v: volume, // Volume (optional)
        },
      ],
    },
  ],

  theme: {
    mode: "light", // 'light' or 'dark'
  },

  plotOptions: {
    stockChart: {
      indicators: {
        // Configure available indicators
        rsi: { enabled: true },
        macd: { enabled: true },
        "moving average": { enabled: true },
        "bollinger bands": { enabled: true },
        // ... more indicators
      },
    },
  },
};
{
  theme: {
    mode: "dark"; // 'light' or 'dark'
  }
}
You can configure indicators in two ways:
Object Format (Recommended):
plotOptions: {
  stockChart: {
    indicators: {
      'rsi': { enabled: true },
      'macd': { enabled: true },
      'moving average': { enabled: false },
      'bollinger bands': { enabled: true }
    }
  }
}
Array Format:
plotOptions: {
  stockChart: {
    indicators: ["rsi", "macd", "bollinger bands"];
  }
}
These indicators are drawn directly on the price chart:
| Indicator | Key | Description |
|---|---|---|
| Moving Average | "moving average" | Simple moving average line |
| Bollinger Bands | "bollinger bands" | Price volatility bands (upper, middle, lower) |
| Exponential Moving Average | "exponential moving average" | EMA line with exponential weighting |
| Fibonacci Retracements | "fibonacci retracements" | Fibonacci retracement levels (0%, 23.6%, 38.2%, 50%, 61.8%, 100%) |
| Linear Regression | "linear regression" | Linear regression trend line |
| Ichimoku Cloud Indicator | "ichimoku cloud indicator" | Complete Ichimoku system with cloud, lines |
These indicators are displayed in their own panels below the main chart. Note: Only one oscillator can be active at a time.
| Oscillator | Key | Description |
|---|---|---|
| RSI | "rsi" | Relative Strength Index (0-100 scale) |
| MACD | "macd" | Moving Average Convergence Divergence with signal line |
| Volumes | "volumes" | Volume bars showing trading volume |
| Price Volume Trend | "price volume trend" | PVT cumulative indicator |
| Stochastic Oscillator | "stochastic oscillator" | %K and %D stochastic lines |
| Standard Deviation Indicator | "standard deviation indicator" | Price volatility measure |
| Average Directional Index | "average directional index" | ADX trend strength indicator |
| Chaikin Oscillator | "chaikin oscillator" | Volume-based momentum oscillator |
| Commodity Channel Index | "commodity channel index" | CCI overbought/oversold indicator |
| Trend Strength Index | "trend strength index" | TSI momentum indicator |
| Accelerator Oscillator | "accelerator oscillator" | Acceleration/deceleration of price movement |
| Bollinger Bands %B | "bollinger bands %b" | Position within Bollinger Bands (0-1 scale) |
| Bollinger Bands Width | "bollinger bands width" | Width of Bollinger Bands (volatility measure) |
Adding Overlays (multiple allowed):
// Add multiple overlays simultaneously
apexStock.updateIndicator("moving average");
apexStock.updateIndicator("bollinger bands");
apexStock.updateIndicator("fibonacci retracements");
Adding Oscillators (only one at a time):
// Add RSI (removes any existing oscillator)
apexStock.updateIndicator("rsi");

// Switch to MACD (removes RSI)
apexStock.updateIndicator("macd");
Configuration in Chart Options:
plotOptions: {
  stockChart: {
    indicators: {
      // Overlays (can have multiple)
      'moving average': { enabled: true },
      'bollinger bands': { enabled: true },
      'exponential moving average': { enabled: true },

      // Oscillators (only one will be active)
      'rsi': { enabled: false },
      'macd': { enabled: true },  // This will be the active oscillator
      'volumes': { enabled: false }
    }
  }
}
render()Renders the chart and initializes all components.
apexStock.render();
update(newOptions)Updates the chart with new options while preserving state.
apexStock.update({
  series: [{ data: newData }],
  theme: { mode: "dark" },
});
destroy()Cleans up the chart instance and removes event listeners.
apexStock.destroy();
updateTheme(newTheme)Changes the chart theme.
apexStock.updateTheme("dark"); // or 'light'
getTheme()Returns the current theme.
const currentTheme = apexStock.getTheme(); // 'light' or 'dark'
updateIndicator(indicatorKey)Adds or updates a specific indicator.
apexStock.updateIndicator("rsi");
apexStock.updateIndicator("moving average");
removeIndicator(indicatorKey)Removes a specific indicator.
apexStock.removeIndicator("rsi");
updateChartOptions(newOptions)Updates chart options with theme handling.
apexStock.updateChartOptions({
  chart: { height: 800 },
  theme: { mode: "dark" },
});
const ma = apexStock.calculateMovingAverage(series, period);
const ema = apexStock.calculateEMA(series, period);
const rsi = apexStock.calculateRSI(series, period);
const macd = apexStock.calculateMACD(
  series,
  fastPeriod,
  slowPeriod,
  signalPeriod
);
const stochastic = apexStock.calculateStochastic(series, period, smoothPeriod);
const bb = apexStock.calculateBollingerBands(series, period, stdDev);
const stdDev = apexStock.calculateStdDevIndicator(series, period);
const pvt = apexStock.calculatePVT(series);
const chaikin = apexStock.calculateChaikinOsc(series, shortPeriod, longPeriod);
const adx = apexStock.calculateADX(series, period);
const cci = apexStock.calculateCCI(series, period);
const tsi = apexStock.calculateTSI(series, longPeriod, shortPeriod);
const ichimoku = apexStock.calculateIchimoku(series);
const fibonacci = apexStock.calculateFibonacciRetracements(series);
const linearReg = apexStock.calculateLinearRegression(series, period);
const chartOptions = {
  // ... basic options
  plotOptions: {
    stockChart: {
      indicators: {
        rsi: { enabled: true },
        "moving average": { enabled: true },
        "bollinger bands": { enabled: true },
        macd: { enabled: true },
      },
    },
  },
};
// Change theme dynamically
apexStock.updateTheme("dark");

// Add indicators programmatically
apexStock.updateIndicator("rsi");
apexStock.updateIndicator("bollinger bands");
Please refer to the ApexCharts license for usage terms and conditions.
FAQs
An extension library for ApexCharts focusing on stock charts
We found that apexstock demonstrated a healthy version release cadence and project activity because the last version was released less than a year ago. It has 1 open source maintainer collaborating on the project.
Did you know?

Socket for GitHub automatically highlights issues in each pull request and monitors the health of all your open source dependencies. Discover the contents of your packages and block harmful activity before you install or update your dependencies.

Product
Socket Fix 2.0 brings targeted CVE remediation, smarter upgrade planning, and broader ecosystem support to help developers get to zero alerts.

Security News
Socket CEO Feross Aboukhadijeh joins Risky Business Weekly to unpack recent npm phishing attacks, their limited impact, and the risks if attackers get smarter.

Product
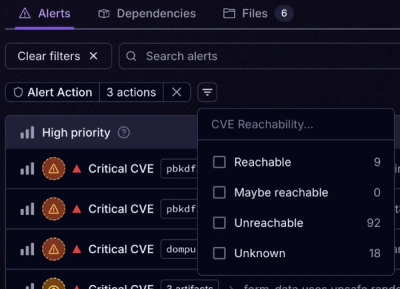
Socket’s new Tier 1 Reachability filters out up to 80% of irrelevant CVEs, so security teams can focus on the vulnerabilities that matter.